Download
1 / 60
990 likes | 1.71k Vues
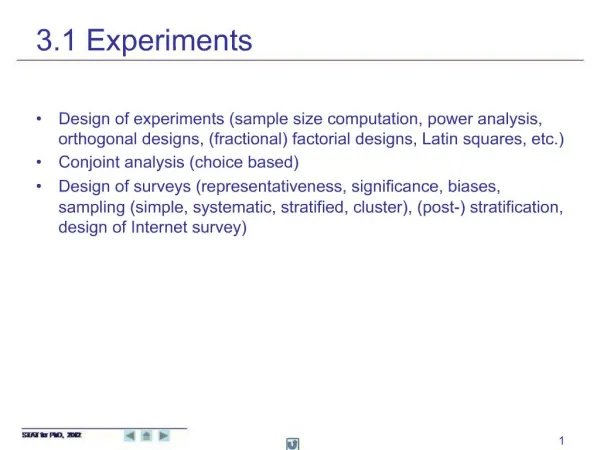
Design and Analysis of Experiments Lecture 3.1. Review of Lecture 2.2 Wine tasting measurement design matrix dual role 2 3 experiment 3 factors each at 2 levels 2 4 in 16 runs with no replicates Normal plot, Pareto chart Lenth's method Reduced model method

E N D
Design and Analysis of ExperimentsLecture 3.1 • Review of Lecture 2.2 • Wine tasting measurement • design matrix • dual role • 23 experiment • 3 factors each at 2 levels • 24 in 16 runs with no replicates • Normal plot, Pareto chart • Lenth's method • Reduced model method • Introduction to Fractional Factorial Designs • "Coefficients" in Minitab output Diploma in Statistics Design and Analysis of Experiments
Minute Test: How Much Diploma in Statistics Design and Analysis of Experiments
Minute Test: How Fast Diploma in Statistics Design and Analysis of Experiments
Homework 2.2.1 A 22 experiment Project: optimisation of a chemical process yield Factors (with levels): operating temperature (Low, High) catalyst (C1, C2) Design: Process run at all four possible combinations of factor levels, in duplicate, in random order. Diploma in Statistics Design and Analysis of Experiments
Results Diploma in Statistics Design and Analysis of Experiments
Calculating s and df Diploma in Statistics Design and Analysis of Experiments
Calculation of t-statistic Results (Temperature order) 52.75 75.75 23 2.6 8.8 Diploma in Statistics Design and Analysis of Experiments
Homework 2.2.1 Test the statistical significance of and calculate confidence intervals for the Catalyst effect and the Temperature × Catalyst interaction. Diploma in Statistics Design and Analysis of Experiments
Interaction illustrated 33.0 8.5 11.5 13.0 Diploma in Statistics Design and Analysis of Experiments
ApplicationFinding the optimum More Minitab results Least Squares Means for Yield Mean SE Mean Temperature Low 52.75 1.854 High 75.75 1.854 Catalyst 1 63.50 1.854 2 65.00 1.854 Temperature*Catalyst Low 1 57.00 2.622 High 1 70.00 2.622 Low 2 48.50 2.622 High 2 81.50 2.622 Diploma in Statistics Design and Analysis of Experiments
Optimum operating conditions Highest yield achieved with Catalyst 2 at High temperature. Estimated yield: 81.5% 95% confidence interval: 81.5 ± 2.78 × 2.622, i.e., 81.5±7.3, i.e.,( 74.2 , 88.8 ) Diploma in Statistics Design and Analysis of Experiments
Part 2 Wine tasting measurement As part of a project to develop a GC method for analysing trace compounds in wine without the need for prior extraction of the compounds, a synthetic mixture of aroma compounds in ethanol-water was prepared. The effects of two factors, Injection volume and Solvent flow rate, on GC measured peak areas given by the mixture were assessed using a 22 factorial design with 3 replicate measurements at each design point. The results are shown in the table that follows. What conclusions can be drawn from these data? Display results numerically and graphically. Check model assumptions by using appropriate residual plots. Diploma in Statistics Design and Analysis of Experiments
Peak areas for GC study Diploma in Statistics Design and Analysis of Experiments
Organising the data for analysis Diploma in Statistics Design and Analysis of Experiments
Organising the data for analysis s2 = average(SD2) = ( 2.302 + 4.012 + 4.922 + 3.692 ) / 4 = 14.798 s = 3.85 df(s) = sum[df(SD)] = 2 + 2 + 2 + 2 = 8 Diploma in Statistics Design and Analysis of Experiments
Introducing the design matrix Organising the data for calculation Generic notation Diploma in Statistics Design and Analysis of Experiments
The design matrix • Prior to the experiment, the rows designate the design points, the sets of conditions under which the process is to be run. • After the experiment, the columns designate the contrasts, the combinations of design point means which measure the main effects of the factors. Diploma in Statistics Design and Analysis of Experiments
Calculating interaction effects,the extended design matrix The extended design matrix AB Interaction = ½(A effect at high B – A effect at low B) = = Check: AB = A × B Diploma in Statistics Design and Analysis of Experiments
Part 3 3 factors each at 2 levels, a 23 experiment An experiment to investigate the effects on yield of a chemical process of changes to operating Temperature, raw material Concentration and type of Catalyst was conducted in a pilot plant set up for experimentation. Details were as follows. Factor settings and codes Diploma in Statistics Design and Analysis of Experiments
Design Diploma in Statistics Design and Analysis of Experiments
Design Diploma in Statistics Design and Analysis of Experiments
Design Diploma in Statistics Design and Analysis of Experiments
Results Diploma in Statistics Design and Analysis of Experiments
Results, in standard order Diploma in Statistics Design and Analysis of Experiments
3-factor interaction measures the change in any 2fi when the third factor changes. e.g., the change in T×C between low and high K. Report results separately at all 23 combinations Diploma in Statistics Design and Analysis of Experiments
Calculating s 2 8 32 2 8 8 2 2 Total 64 s2 8 s 2.83 Diploma in Statistics Design and Analysis of Experiments
Exercise 3.1.1 Calculate the t-ratio for the T effect, the TC 2-factor interaction and the TCK 3-factor interaction. What conclusions do you draw? Diploma in Statistics Design and Analysis of Experiments
Minitab analysis Estimated Effects for Yield Term Effect SE T P T 23.0 1.414 16.26 0.000 C -5.0 1.414 -3.54 0.008 K 1.5 1.414 1.06 0.320 T*C 1.5 1.414 1.06 0.320 T*K 10.0 1.414 7.07 0.000 C*K 0.0 1.414 0.00 1.000 T*C*K 0.5 1.414 0.35 0.733 S = 2.82843 Diploma in Statistics Design and Analysis of Experiments
Minitab analysis Diploma in Statistics Design and Analysis of Experiments
Minitab analysis Diploma in Statistics Design and Analysis of Experiments
Minitab analysis Diploma in Statistics Design and Analysis of Experiments
Minitab diagnostic analysis Diploma in Statistics Design and Analysis of Experiments
Minitab diagnostic analysis Diploma in Statistics Design and Analysis of Experiments
Homework 3.1.1 An experiment was run to assess the effects of three factors on the life of a cutting tool A: Cutting speed B: Tool geometry C: Cutting angle. The full 23 design was replicated three times. The results are shown in the next slide and are available in Excel file Tool Life.xls. Carry out a full analysis and report. Diploma in Statistics Design and Analysis of Experiments
Homework Diploma in Statistics Design and Analysis of Experiments
Part 4 24 in 16 runs, no replicates A process development study with four factors each at two levels Low (–)High (+) A: Catalyst Charge (lbs) 10 15 B: Temperature (C) 220 240 C: Concentration (%) 10 12 D: Pressure (bar) 50 80 Diploma in Statistics Design and Analysis of Experiments
24 in 16 runs, no replicates Diploma in Statistics Design and Analysis of Experiments
No replication: alternative analyses • Normal plots of effects • if no effects present, estimated effects reflect chance variation, follow Normal model • a few real effects will appear as exceptions in a Normal plot • Lenth method • alternative estimate of s, given a few real effects • Best approach: combine both! Diploma in Statistics Design and Analysis of Experiments
No replication: alternative analyses Estimated Effects for Yield (%) (use design matrix columns) Term Effect Catalyst Charge -8.000 Temperature 24.000 Concentration -5.500 Pressure -0.250 Catalyst Charge*Temperature 1.000 Catalyst Charge*Concentration -0.000 Catalyst Charge*Pressure 0.750 Temperature*Concentration 4.500 Temperature*Pressure -1.250 Concentration*Pressure -0.250 Diploma in Statistics Design and Analysis of Experiments
Normal Effects Plot Diploma in Statistics Design and Analysis of Experiments
Pareto Chart,vital few versus trivial many (Juran) Diploma in Statistics Design and Analysis of Experiments
Lenth's method Given several Normal values with mean 0 and given their absolute values (magnitudes, or values without signs), then it may be shown that SD(Normal values) ≈ 1.5 × median(Absolute values). Given a small number of effects with mean ≠ 0, then SD(Normal values) is a small bit bigger. Refinement: PSE ≈ 1.5 × median(Absolute values < 2.5) Diploma in Statistics Design and Analysis of Experiments
Lenth's method illustrated Example Add 50 to 3 values, to represent 3 active effects; median will be 27, 29, 32 or 34; not much bigger, so s will be not much bigger, • provides a suitable basis for a "t"-test. See Laboratory 1 for simulation Diploma in Statistics Design and Analysis of Experiments
Reduced Model method • Select identified terms for a fitted model • omitted terms provide basis for estimating s • Check diagnostics • Estimate effects • ANOVA used to estimate s • Identify optimal operating conditions Diploma in Statistics Design and Analysis of Experiments
Reduced model Diploma in Statistics Design and Analysis of Experiments
Diagnostics Diploma in Statistics Design and Analysis of Experiments
Diagnostics Diploma in Statistics Design and Analysis of Experiments
Estimated effects Estimated Effects for Yield (%) Term Effect SE T P Catalyst Charge -8.000 0.657 -12.17 0.000 Temperature 24.000 0.657 36.52 0.000 Concentration -5.500 0.657 -8.37 0.000 Temperature*Concentration 4.500 0.657 6.85 0.000 S = 1.31426 Diploma in Statistics Design and Analysis of Experiments
Analysis of Variance (basis for s) Analysis of Variance for Yield (%) Source DF SS MS F P Main Effects 3 2681.00 893.667 517.39 0.000 2-Way Interactions 1 81.00 81.000 46.89 0.000 Residual Error 11 19.00 1.727 Total 15 2781.00 s = sqrt(1.727) = 1.31 Diploma in Statistics Design and Analysis of Experiments
Identify optimal operating conditions Diploma in Statistics Design and Analysis of Experiments