Download
1 / 3
50 likes | 201 Vues
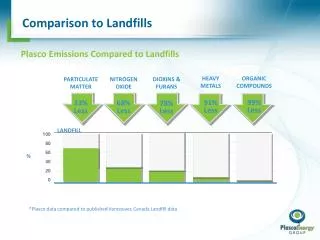
PARTICULATE MATTER. NITROGEN OXIDE. DIOXINS & FURANS. HEAVY METALS. ORGANIC COMPOUNDS. 33% Less. 68% Less. 78% Less. 91% Less. 99% Less. Comparison to Landfills. Plasco Emissions Compared to Landfills. 100 80 60 40 20 0. LANDFILL. %.

E N D
PARTICULATE MATTER NITROGEN OXIDE DIOXINS & FURANS HEAVY METALS ORGANIC COMPOUNDS 33% Less 68% Less 78% Less 91% Less 99% Less Comparison to Landfills Plasco Emissions Compared to Landfills 100 80 60 40 20 0 LANDFILL % *Plasco data compared to published Vancouver, Canada Landfill data.
Maximum POI Concentrations Within Barrhaven South * Conservatively, it was assumed all suspended particulate matter is PM2.5
Air Dispersion Modeling - Location of Barrhaven South Maximum POIs