Boreal Fire Emissions Evaluation with MOPITT: Summer 2004 Study
Investigating total CO emissions from surface and crown fires, including peat burning impact, in the Alaska-Yukon and North-Central Canada regions during June-August 2004. Evaluating fire emission injection heights and their influence using GEOS-Chem CTM and MOPITT satellite observations.

Boreal Fire Emissions Evaluation with MOPITT: Summer 2004 Study
E N D
Presentation Transcript
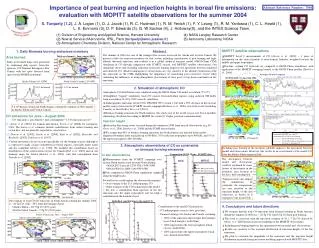
Total area burned – June-August 2004 MOPITT Total CO, June–Aug. 2004 (ha) Alaska-Yukon [165-125W] North-Central Canada [125-90W] 4 106 ha burned 1.1 106 ha burned GEOS-Chem total CO (x MOPITT AK) Area burned (ha) Surface and crown fires only Day since 20040601 Day since 20040601 Including peat burning MOPITT avg. total CO Model: BB no peat burning Model: BB with peat burning Model: BB with peat burning, linear increase btw. June 1st and August 31st MOPITT CO, 15-18/07/2004 GEOS-Chem: 100% BL G-C: 40% BL + 55% FT + 5% UT G-C: 30% BL + 40% FT + 30% UT Data Model, BB no peat burning Model, BB with peat burning Total CO emissions, June – August 2004 Surface and crown fires Contribution from peat burning (Tg CO) Importance of peat burning and injection heights in boreal fire emissions: evaluation with MOPITT satellite observations for the summer 2004 Abstract Reference Number: 7046 S. Turquety(1,2), J. A. Logan (1), D. J. Jacob (1), R. C. Hudman (1), R. M. Yevich (1), F. Y. Leung (1), R. M. Yantosca (1), C. L. Heald (1), L. K. Emmons (3), D. P. Edwards (3), G. W Sachse (4), J. Holloway(5), and the INTEX Science Team. • Division of Engineering and Applied Science, Harvard University • Now at Service d'Aéronomie, IPSL, Paris (turquety@aero.jussieu.fr) • Atmospheric Chemistry Division, National Center for Atmospheric Research • NASA Langley Research Center • Aeronomy Laboratory, NOAA • MOPITT satellite observations • MOPITT Level 2 measurements of CO [Deeter et al., 2003]: ~ 1 piece of information on the vertical profile at extra-tropical latitudes, weighted towards the middle and upper troposphere. • Daytime, column CO retrievals are compared to GEOS-Chem simulations, with application of the MOPITT averaging kernels to the GEOS-Chem profiles [Heald et al., 2004]. • Daily Biomass burning emissions inventory • Area burned Abstract. The summer of 2004 was one of the strongest fire seasons on record for Alaska and western Canada. We present a daily fire emission inventory for that season, including consideration of peat burning and high-altitude (buoyant) injection, and evaluate it in a global chemical transport model (GEOS-Chem CTM) simulation of CO through comparison with ICARTT aircraft, and MOPITT satellite observations. Our simulation shows that including emissions from peat burning improves the agreement between simulated and observed CO. Model comparisons to observations are very sensitive to the altitude of injection of the fire emissions in the CTM, highlighting the importance of considering pyro-convective events when simulating fire influences or using atmospheric observations of trace gases as top-down constraints on fire emissions. Daily area burned maps were generated by combining daily reports from fire agencies (US National Interagency Fire Center) with hot spots detected from space by the MODIS instrument. Average CO within regions • Simulation of atmospheric CO • Atmospheric CO distributions were simulated using the GEOS-Chem 3-D model (resolution: 2º×2.5º): • Simplified, “tagged” simulation: track CO sources from individual regions, using archived OH fields from a non-linear O3-NOx-VOC-aerosols simulation. • Anthropogenic emissions for the USA: EPA NEI 1999 version 1, but with a 50% decrease in the on-road mobile sources based on the ICARTT aircraft campaign [Hudman et al., 2006]; rest of the world (including Canada): as described by Bey et al. [2001]. • Biomass burning emissions for North America: this study; rest of the world: Logan and Yevich monthly climatology distributed according to MODIS fire counts [L. Giglio, personal communication]. • Injection height • Indication that strong events occurred during the summer of 2004 from aircraft observations [e.g. De Gouw et al., 2006; Kittaka et al., 2006] and the TOMS aerosol index. • We assume that 40% of biomass burning emissions for North America are injected in the model-diagnosed boundary layer (typically up to 800 hPa), 55% in the free troposphere up to 400 hPa, and 5% in the upper troposphere (400–200 hPa). 5.6 106 hectares burned in North America during the summer of 2004, mainly in Alaska-Yukon and Central Canada. CO emissions for June – August 2004 • CO emissions = area burned × fuel consumption(1) × CO emission factors(2) • (1) Amiro et al. [2001] for Canada and Alaska, Yevich et al. [2006] for contiguous USA. The Amiro et al. estimates include contributions from surface burning and crown fires, but are generally regarded as conservative. • (2)Duncan et al. [2003]; Goode et al. [2000]; Kajii et al. [2002]; Kasischke and Bruhwiler [2003]; Yokelson et al. [1997]. • Current inventories do not account specifically for the burning of peat, although it is expected to make a large contribution in boreal regions, especially under warm and dry conditions [Zoltai et al., 1998]. We included this contribution based on distributions of the areal fraction of peat for Canada [Hall et al., 2001] and on soil drainage maps for Alaska [Harden et al., 2003], with fuel consumption from Turetsky et al. [2002]. • Atmospheric observations of CO as constraints • on biomass burning emissions • In situ observations Including peat burning in the inventory globally improves the agreement between model and observations. However, this results in an overestimate of the model CO over the Alaska-Yukon region in July. Comparison GEOS-Chem – ICARTT data The discrepancy between model and observations could be explained by many factors of uncertainty in the inventory: area, location of the fires, fuel consumption. • Measurements from the ICARTT campaign over eastern North America and western North Atlantic: • NASA DC-8 aircraft: [27N-53N;139W-36W] • NOAA WP3-D: [28N-53N;59W-85W] • Data compared to GEOS-Chem simulations sampled along the flight tracks • Several factors could explain the observed discrepancy: • Over-estimate of the U.S. anthropogenic CO • Under-estimate of the CO background in the model • Too low a contribution from injection of the fire emissions into the upper troposphere and too high a contribution in the boundary layer. Above ground biomass Contribution from peat WP3-D DC8 Potential fuel consumption Transport errors also impact the simulations. In particular, the comparisons are very sensitive to the injection height of the fire emissions, as shown on a transport event in mid-July. CO emission factor • Our estimate of total CO fire emissions in North America during the summer 2004 is ~ 26 Tg CO, with ~ 30% from the burning of peat: • Alaska-Yukon ~ 20.5 Tg CO (25% peat); • North-Central Canada ~ 5 Tg CO (50% peat). Individual contributions to the model CO • Conclusions and future directions • We estimate that the total CO emissions from biomass burning in North America during the summer of 2004 was ~ 26 Tg CO, with 8 Tg CO from peat burning; • This total is consistent with the top-down estimate of 30 ± 5 Tg CO derived by Pfister et al. [2005] from an inverse modeling of the MOPITT observations; • Including peat burning improves the agreement between model and observations; • Results are sensitive to the assumed distribution of injection heights of the fire emissions; • We plan to constrain the magnitude of the emissions and the injection height distribution in parallel using an inverse modeling approach with MOPITT data. • Contributions to the model CO plotted for: • US anthropogenic sources (dots, grey line), • biomass burning over Alaska and Canada, assuming: • 100% of the emissions injected into the boundary layer (black triangles, dotted line); • 100% injected into the free troposphere (black crosses, dashed line); • 100% injected into the upper troposphere (black stars, dashed-dotted line).