
Uploaded by
raymond-martin
1 SLIDES
118 VUES
10LIKES
Genomic Sequencing Data Statistics and Distribution Analysis
DESCRIPTION
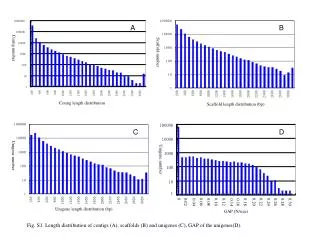
Explore the distribution of contig, scaffold, and unigene lengths in a genome. Analyze the number and size distribution of contigs, scaffolds, and unigenes. Visualize the data to understand the genomic structure.
Download
1 / 1
Télécharger la présentation 
Genomic Sequencing Data Statistics and Distribution Analysis
An Image/Link below is provided (as is) to download presentation
Download Policy: Content on the Website is provided to you AS IS for your information and personal use and may not be sold / licensed / shared on other websites without getting consent from its author.
Content is provided to you AS IS for your information and personal use only.
Download presentation by click this link.
While downloading, if for some reason you are not able to download a presentation, the publisher may have deleted the file from their server.
During download, if you can't get a presentation, the file might be deleted by the publisher.
E N D
Presentation Transcript
A B 1000000 Contig number 100000 Scaffold number 10000 1000 100 10 1 200 400 600 800 2000 1200 1400 1600 1800 2200 2400 1000 2600 2800 3000 Contig length distribution Scaffold length distribution (bp) 100000 C D 10000 Unigene number Unigene number 1000 100 10 1 0.02 0 0.06 0.08 0.10 0.12 0.18 0.20 0.22 0.24 0.26 0.28 0.30 0.04 0.14 0.16 Unigene length distribution (bp) GAP (N/size) Fig. S1. Length distribution of contigs (A), scaffolds (B) and unigenes (C), GAP of the unigenes(D).
More Related