Download
1 / 18
180 likes | 198 Vues
This research study examines the impact of obsolescence on the real estate office market, focusing on yield and rent performance. The analysis provides valuable insights into the extent and variations of obsolescence, highlighting the need for further research. The study is based on a unique dataset from the Netherlands, but it encourages expanding the research to other countries.

E N D
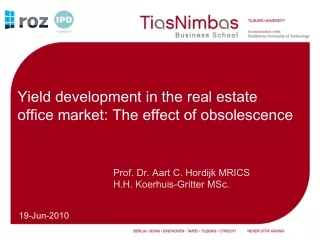
Yield development in the real estate office market: The effect of obsolescence Prof. Dr. Aart C. Hordijk MRICS H.H. Koerhuis-GritterMSc.
Contents • Why bother about obsolescence? • Data • Analysis • Results • Conclusions • Suggestions for further research
Why bother about obsolescence? • Buildings grow old • Valuations: • GIY/NIY method raise on initial yield • DCF method exit value • Obsolescence hidden because of continuing sharpening of yields in rising markets • Change in market circumstances • Renovation or depreciation
Data • ROZ/IPD Property index • 15 years of valuation data • Unique dataset offers research opportunities
Analysis • 1 Reversionary yield vs exit yield (DCF Method) • 2 Yield in relation to year of construction • 3 Yield of properties 10 years in index vs market yield • 4 Market rent in relation to year of construction
Explanations • Initial yield: Contract rent (excl vacancy) • Value of the property • Reversionary yield: Market rent (incl vacancy) • Value of the property • Exit yield: Market rent (excl vacancy) in year 11 • Value of the property in year 11
Analysis 1: Method Reversionary yield vs exit yield (DCF Method) • 1995 – 2008 data • Reversionary yield instead of initial yield • 10 years DCF horizon • Difference between weigthed average RY and EY • Absolute and in percentage terms • Centre vs non-centre locations
Analysis 1: Results • Average % difference 11.4% for a 10 years period (1.1% • per year) • Average absolute difference is 0.92 % point (0.09 % point • per year)
Analysis 1: Results • Spread is less for offices on centre locations (0.82 % point) • than for offices on non-centre location (0.93 % point)
Analysis 2: Method Yield in relation to year of construction • 1995 – 2008 data • Reversionary yield, weigthed average • Year of construction classes:
Analysis 2: Results • On average a 10 year younger building had a 0.8% point • lower yield, which means 0.08% point per year
Analysis 3: Method Held properties vs market yield • 1999 – 2008 data • 243 properties which have been in the ROZ/IPD Index for 10 years • Market yield as calculated by IPD • Difference absolute and in percentage terms
Analysis 3: Results • The longer properties are in portfolio the more their • performance will stay behind the market performance • Obsolescence is on average 0.07% point per year • In percentage terms the difference 1% per year
Analysis 4: Method Market rents per year of construction • Market rents per square meter from 2001 to 2008 • Year of construction classes as in analysis 2
Analysis 4: Results • On average 16 euro decrease in market rent in 10 years • Average market rent is 130 euro, so 12% decrease in 10 years, which is around 1 percent per year
Conclusions • Obsolescence in yield varies between 0.09, 0.08 and 0.07 percentage point per year as result from analysis 1, 2 and 3 (1% per year in percentage terms) • Obsolescence in rent around 1 percent per year in analysis 4 • In general obsolescence turns out to be higher than generally is expected
Further research • Research is based on office figures from The Netherlands alone • Extention of the research to other countries is highly recommended
Thank you! Contacts: • Prof. Dr. Aart C. Hordijk MRICS • University of Tilburg • a.c.hordijk@tiasnimbas.edu • Leonie Koerhuis-Gritter MSc. • IPD Netherlands • leonie.koerhuis@ipd.com