Download
1 / 14
140 likes | 161 Vues
Our Shared Seas is a website platform that aggregates ocean conservation data to support informed decision-making in marine conservation. It provides authoritative data on trends and threats, making it easy for stakeholders to access and use.

E N D
While it is often said that the world is awash in data, informed decision-making can occur only when data are transparent and readily available to the stakeholders that need the information. Our Shared Seas is a website platform which seeks to roll up relevant ocean conservation data in a centralized, easy-to-use platform, providing authoritative data and sensemaking of ocean trends. • The purpose of this project is to aggregate ocean statistics and trends to support the marine conservation community—including funders, advocates, practitioners, and policymakers—in making better, faster, and more informed decisions. In 2017, the David and Lucile Packard Foundation commissioned CEA Consulting to prepare Our Shared Seas: A 2017 Overview of Ocean Threats and Conservation Funding as a primer on the primary ocean threats, trends, and solutions. As a second edition of the original narrative report, the 2019 edition takes the form of a website is which provides updated figures and share key data points in a format that is easy to digest and use for external purposes. • Visitors are welcome to download both individual charts directly from the site and PowerPoint decks for external use, provided that corresponding references are cited. • This deck serves as a companion piece to the Our Shared Seas website. Readers are encouraged to visit the website for additional data and analysis at www.OurSharedSeas.com.
Pollution and Development: Overview No area of the ocean is completely untouched by human impact. The marine environment faces a broad range of human stressors from physical alterations (i.e., coastal habitat loss and changes in freshwater inputs), chemical alterations (i.e., eutrophication, plastic debris, and toxic contaminants) and direct effects on wildlife (i.e., invasive species, vessel strikes, and noise pollution). An attempt to rank ecosystem-level threats from human stressors emphasized the suite of threats associated with climate change, commercial fishing, coastal habitat destruction, and pollution. Top ten exporters of fish and fish products, by value (2006 vs. 2016) Source: Crain, C., B.S. Halpern, M.W. Beck, and C.V. Kappel. “Understanding and Managing Human Threats to the Coastal Marine Environment.” The Year in Ecology and Conservation Biology 1162 (2009): 39–62.
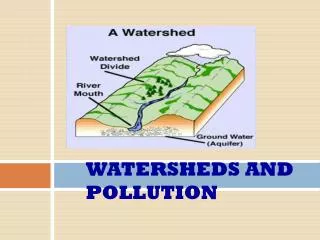
Pollution and Development: Global hotspots A recent study identified hotspots of high and low human impact in the ocean. Hotspots with consistently high human impacts include the Northeast Atlantic, the eastern Mediterranean, the Caribbean, the continental shelf off northern West Africa, offshore parts of the tropical Atlantic, the Indian Ocean east of Madagascar, parts of East and Southeast Asia, parts of the northwestern Pacific, and many coastal waters. Areas with consistently low human impacts were limited to a small number of remote places: the waters off Antarctica, the central Pacific, and in the southern Atlantic. A) The most impacted 25% of the ocean and B) the least impacted 25% of the ocean Stock, Andy, Crowder, L.B., Halpern, B.S., Micheli, F. “Uncertainty analysis and robust areas of high and low modeled human impact on the global oceans.” Conservation Biology 32 (2018): 1368-1379. https://doi.org/10.1111/cobi.13141.
Pollution and Development: Coastal habitat conversion Human pressure on the marine environment is most acute along the world’s coastlines. From draining wetlands and clearing mangrove habitat, to filling in estuaries and hardening shorelines, the conversion of coastal ecosystems has made them one of the most modified and threatened ecosystems globally. In major coastal cities such as Hong Kong, Sydney, and New York, more than half of the shoreline is hardened. In coastal China, the trend of shoreline hardening increased sharply in the early 2000’s, in close correlation with rising GDP per capita in the country. Satellite imagery of coastal reclamation in Nahui shore near Shanghai, China Source: Tian, B., W. Wu, Z. Yang, and Y. Zhou. “Drivers, Trends, and Potential Impacts of Long-term Coastal Reclamation in China from 1985 to 2010.” Estuarine, Coastal, and Shelf Science 170 (2016): 83–90.
Pollution and Development: Coastal habitat conversion The expanding footprint of human development in the coastal zone has been evident in the loss of mangrove forests worldwide. At least 35 percent of mangrove area was lost globally during the 1980s and 1990s alone. The rate of global mangrove deforestation has since declined significantly. While the rate of deforestation has stabilized or declined in many countries, Southeast Asia remains the epicenter of mangrove loss, with deforestation rates between 3.6 to 8.1 percent. Mangrove area lost by top 20 countries (2000-2012) Top 20 nation rankings for (a) total mangrove area lost between the years 2000 and 2012, (b) area loss as a percent of year 2000 mangrove area. Source: Sanderman, Jonathan, Tomislav Hengl, Greg Fiske, KylenSolvik, Maria Fernanda Adame, Lisa Benson, Jacob J Bukoski, et al. “A Global Map of Mangrove Forest Soil Carbon at 30 m Spatial Resolution.” Environmental Research Letters 13, no. 5 (2018): 055002. https://doi.org/10.1088/1748-9326/aabe1c.
Pollution and Development: Growing toll of pollution The aggregate effect of all pollution on the marine environment is not fully known, but indicators suggest that it is likely worsening. The most common form of pollution entering the marine environment is the large-scale input of nutrients (i.e., nitrogen, phosphorus), which can result in eutrophication and declining oxygen levels. Deoxygenation is one of the most consequential anthropogenic impacts on the ocean, given that oxygen decline can cause major changes in ocean productivity, biodiversity, and biogeochemical cycles. As a proxy for eutrophication, the number of marine “dead zones” or hypoxic sites has continued to increase in number and severity in recent decades. Low and declining oxygen levels in the ocean and coastal waters Source: Breitburg, Denise, L.A. Levin, A. Oschlies, M. Grégoire, F.P. Chavez, D.J. Conley, V. Garçon, et al. “Declining Oxygen in the Global Ocean and Coastal Waters.” Science 359, no. 6371 (2018): https://doi.org/10.1126/science.aam7240.
Pollution and Development: Growing toll of pollution Plastic debris accounts for the largest portion of marine pollution in the ocean by volume. Roughly half of all plastic ever produced was made in the last 15 years. Global plastic production has increased nearly 200-fold, from 2 million tonnes in 1950 to 381 million tonnes in 2015. During 1950–2015, plastic production grew at a compound annual growth rate of 8.4 percent. Asia is the leading producer of plastic: nearly 50 percent of global production was in Asia in 2015, of which China accounted for almost 30 percent of production. Global plastics production (1950-2015) Source: Geyer, Roland, J.R. Jambeck, and K.L. Law. “Production, Use, and Fate of All Plastics Ever Made.” Science Advances 3, no. 7 (2017). https://doi.org/10.1126/sciadv.1700782.
Pollution and Development: Growing toll of pollution The best available estimates suggest that 4.8 to 12.7 million metric tons of plastic waste enter the marine environment annually from land-based sources. The extent and quality of waste management remains a key determinant in terms of which countries contribute the most significant plastic waste inputs per capita from land into the ocean. Over half of plastic entering the ocean comes from five rapidly growing economies—China, Indonesia, the Philippines, Thailand, and Vietnam. Interventions in these five countries could reduce global plastic-waste leakage by roughly 45 percentage over the next ten years. Spatial patterns of plastic production and pollution Source: Worm, Boris, H.K. Lotze, I. Jubinville, C. Wilcox, and J. Jambeck.“Plastic as a Persistent Marine Pollutant.” Annual Review of Environment and Resources 42, no. 1 (2017): 1-26. https://doi.org/10.1146/annurev-environ-102016-060700.
Pollution and Development: Growing toll of pollution Entanglement and ingestion of plastic is one of the most commonly documented impacts of plastic pollution on marine life. Notable increases in plastic ingestion have been documented in seabirds and marine turtles alike, with an annual rate of increase of 1.7 percent for seabirds and 0.7 percent for turtles in recent years. Researchers expect that both lethal and sublethal impacts from plastic ingestion will result in population-level changes among these marine species. While quantitative data remain limited at the global level, an expert survey suggests that among types of plastic pollution, marine mammals are most vulnerable to experience negative impacts from lost or intentionally discarded fishing gear (“ghost gear”), followed by plastic bags. Increasing effects of plastic pollution on sea bird and sea turtle specie Source: Worm, Boris, H.K. Lotze, I. Jubinville, C. Wilcox, and J. Jambeck.“Plastic as a Persistent Marine Pollutant.” Annual Review of Environment and Resources 42, no. 1 (2017): 1-26. https://doi.org/10.1146/annurev-environ-102016-060700.
Pollution and Development: Footprint of ocean industries The volume of global maritime traffic continues to grow, with direct and indirect ramifications for the marine environment. The global maritime industry has steadily increased in both the number of ships and in total shipping capacity. Seaborne trade increased by 4 percent to 10.7 billion tons in 2017, the fastest growth in five years. The level of industrial activity on the ocean is expected to increase in coming years. According to the OECD, ocean industries generated USD 1.5 trillion in economic activity in 2010; this amount is expected to double to USD 3 trillion in 2030. Growth of international seaborne trade Source: UNCTAD. “Review of Maritime Transport 2018.” UNCTAD/RMT/2018. Geneva, Switzerland, 2018.
Pollution and Development: Footprint of ocean industries Even as seaborne trade of oil has steadily increased in recent decades, available data indicate the number and size of oil spills from tankers have concurrently decreased. In the 1970s, the annual amount of oil entering the marine environment from tankers was approximately 314,000 tons, through almost 80 spills per year. By the early 2000s, the average annual amount had decreased to roughly 21,000 tons, and just 6 spills per year. Number of oil spills (>7 tonnes) Source: ITOPF. “Oil Tanker Spill Statistics 2018.” 2019. ITOPF: London, U.K. http://www.itopf.org/fileadmin/data/Documents/Company_Lit/Oil_Spill_Stats_2019.pdf.
Pollution and Development: Footprint of ocean industries Current trends suggest that offshore oil and gas production is slated to increasingly venture into deepwater and ultra-deepwater sectors. As compared to newly discovered onshore fields, recently discovered offshore fields are about 10 times larger, which has provided an economic incentive for industry, in spite of high upfront costs and inherent environmental risk. Global offshore oil and gas production accounted for roughly one-third of total oil and gas output in 2016. Over the past decade, offshore oil production has remained steady, while offshore gas production has expanded by nearly 30 percent. Global offshore oil and natural gas production by water depth Source: International Energy Agency. “Offshore Energy Outlook” IEA: Paris, France. 2018.
The David and Lucile Packard Foundation is a private family foundation created in 1964 by David Packard (1912–1996), cofounder of the Hewlett-Packard Company, and Lucile Salter Packard (1914–1987). The Foundation provides grants to nonprofit organizations in the following program areas: Conservation and Science; Population and Reproductive Health; Children, Families, and Communities; and Local Grantmaking. The Foundation makes national and international grants and also has a special focus on the Northern California counties of San Benito, San Mateo, Santa Clara, Santa Cruz and Monterey. Today, the Packard Foundation’s ocean investments are focused in six countries and on a suite of global strategies that together offer great potential for accelerating positive change. Learn more at www.packard.org. Since 1984, California Environmental Associates (CEA) has supported the work of environmental foundations and nonprofits as well as sustainability-oriented businesses with in-depth research and analysis, program design and evaluation, and strategic planning. Learn more at www.ceaconsulting.com. Please use the following citation when referencing this project as a body of work: CEA Consulting. 2019. “Our Shared Seas: Global ocean data and trends for informed action and decision-making.”