Predicting Pitcher Strikeouts and Analyzing Data Trends in Sports
This guide outlines essential steps to analyze pitcher data to predict strikeouts for Hall of Fame pitchers with 200 wins. It details methods such as creating scatter plots, finding correlation coefficients, determining regression equations, and making predictions. Additionally, we'll explore temperature predictions based on cricket chirping patterns, assess average SAT scores across states for potential relationships, and predict fireworks-related injuries based on usage data. Each section encourages statistical reasoning and the application of mathematical tools to real-world scenarios.

Predicting Pitcher Strikeouts and Analyzing Data Trends in Sports
E N D
Presentation Transcript
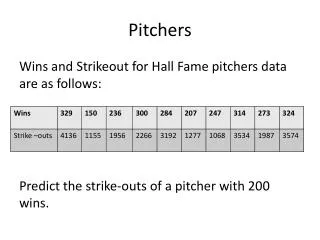
Pitchers Wins and Strikeout for Hall Fame pitchers data are as follows: Predict the strike-outs of a pitcher with 200 wins.
To complete the problem some steps to follow are: • Create a scatter plot. • Find the correlation coefficient. • Decide whether its worth your time. • Determine the regression equation. • Use the regression equation to make a prediction.
Chirp, Chirp, Chirp! Find the best predicted temperature (in °F) at a time when cricket chirps 3000 times in one minute. What is wrong with this predicted value?
SAT Scores Several states where randomly selected, and their average SAT scores are recorded below. Is there a sufficient evidence to conclude a relationship between the two scores?
Fireworks The data below indicates the number of fireworks (in millions) used and the related injuries. Predict the number of injuries if 100 million fireworks are used during a given year.