Download
1 / 37
370 likes | 487 Vues
University of Aveiro. Department of Environment and Planning. Air pollutants dispersion disturbance due to urban vegetation: a porous media modelling approach to Lisbon city centre. J.H. Amorim , A.I. Miranda, C. Borrego. NATO ASI – 7 th of May 2004 – Kyiv, Ukraine.

E N D
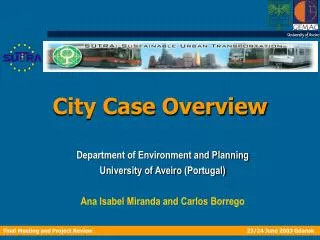
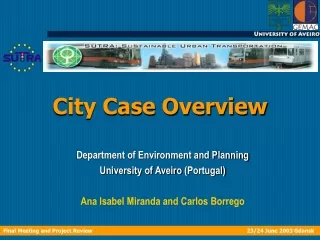
University of Aveiro Department of Environment and Planning Air pollutants dispersion disturbance due to urban vegetation: a porous media modelling approach to Lisbon city centre J.H. Amorim, A.I. Miranda, C. Borrego NATO ASI – 7th of May 2004 – Kyiv, Ukraine
INDEX of the presentation • Motivation and objective of the work • Methodology applied • General characterisation of the model: FLUENT • Description of the study-case (Liberdade Av., Lisbon) • FLUENT application to the study-case • Results presentation and analysis • Conclusions
What is the relative importance of the perturbations induced by vegetation on air pollutants dispersion within urban environments? - densely populated - high road-traffic emissions Areas with problematic air quality standards - complex 3Dstructures - turbulent flow field Computationally challenging problems - trees are commonly found on cities MOTIVATION As buildings, although with less significant consequences, trees (if existent) act as roughness elements, modifying the wind field. Consequently, the analysis of the dispersion conditions within a given area may become incomplete if these impacts were not considered.
main OBJECTIVE and METHODOLOGY How far from the reality can we be if neglecting these effects?? As a first approach, the vegetative canopy effect over flow and air pollutants concentration fields inside a typical urban environment was simulated applying a simple empirical model.
FLUENT MODEL validation General purpose CFD commercial numerical model As FLUENT is intended for a wide range of engineering studies, its feasibility on local scale air quality modelling was previously evaluated. • FLUENT vs Wind Tunnel • - idealised urban geometry • Hot-wire anemometry (wind field comparison) • Flame Ionisation Detection (FID) (concentration field comparison) • FLUENT vs CFD model (VADIS) • real urban geometry (Lisbon downtown) • wind and concentration fields comparison
FLUENT model (brief) characterisation Flow modelling: Eulerian approach Simplifications: Steady-state 3D flow (1 hour averaged input/output values) Incompressible fluid Turbulence modelling: Reynolds-averaged Navier-Stokes (RANS) equations closure: k- model Dispersion modelling: Eulerian approach No chemical reactions: CO (inert pollutant)
FLUENT application to LIBERDADE Av. Simulation domain Liberdade Av. Lisbon downtown • Centred at Liberdade Avenue, one of the main thoroughfares of Lisbon city centre • aspect ratio: H/W = 0.33 • Simulation period: • 24 h • typical working day (6th March, 2002) “avenue canyon” (<0.5)
Emission sources definition 4 1 – Liberdade Av. 2 – Liberdade Av. (descending secondary lane) 3 – Liberdade Av. (ascending secondary lane) 4 – A. Herculano St. 5 – Rua B. Salgueiro St. 6 – Rua M. Silveira St. 7 – Rua R. Araújo St. 8 – Rua R. Sampaio St. 9 – Rua S. Marta St. 10 – Rua J. Machado St. 11 – Rua M. Coelho St. 12 – Rua do Salitre St. 6 9 7 8 8 9 5a 5b 5 5 1 1 10 10 2 3 12 12 11 12 11 Air quality monitoring station (AQMS)
Emissions estimation Road traffic emissions estimation: TRansport Emission Model for line sources (TREM) • - developed at the University of Aveiro • based on MEET/COST methodology • emission factors are based on the average vehicles speed (this approach is considered correct when the influence of driving dynamics can be neglected) • vehicles emissions are estimated individually for each road segment considering detailed information on traffic flux counting (VISUM traffic model output) CO emission (g.km-1.h-1) Traffic flux (n.º vehicles.h-1) Time (h) Traffic flux counting (Liberdade Av.) CO emission estimated by TREM
Wind velocity Wind direction Meteorological data • Meteorological station located nearby the computational domain • Hourly averaged values of: • wind velocity and direction (10 m height), air temperature and RH • Variable wind velocity (minimum: 4 m.s-1; maximum: 7 m.s-1) • Predominant wind direction: NW • Boundary conditions: logarithmic vertical wind profile S E N Direction Velocity (m.s-1) W S Time (h)
Presence of a large number of densely foliaged tall trees that flank the Avenue in its entire extension… Special characteristic of the domain
Vegetation characterisation … creating a “green corridor” between both sides of the Av. and the houses. a modified street-canyon wind pattern is expected due to the crown-induced disturbed flow.
Vegetation characterisation The AQMS (National Air Quality Monitoring Net) is located within the expected disturbance induced by the trees foliage
Domain 3D perspective with “vegetation” definition Shape: regular blocks Ground distance: 5 m Dimensions: var. 15 m 10 m (L W H) POROUS VOLUMES Porous medium modelling: Power-law approach Source-term [Si, for the ith (x, y, or z) momentum equation] that establishes a relation with the velocity (v): C0 = 10; C1 = 1
Computational domain top view Domain volume: 650 × 650 × 80 m3 (L × W × H) Grid: ~1 million unstructured cells (Gambit pre-processor: TGrid) N.º buildings: 42 sets (h: 12 - 40 m) N.º emission sources: 12 N.º porous media: 6 sets
AQMS FLUENT WITH porous media FLUENT WITHOUT porous media CO concentration (meas. & simul.) temporal variation CO concentration (µg.m-3) time (h) Not despite the empirical characteristics of this approach the results fit better with the measurements in this case.
Model performance statistical analysis More accurate modelling results are obtained when considering the porous media.
Model performance statistical analysis – linear regression withoutporous media withporous media
Conc. CO µg.m-3 Conc. CO µg.m-3 AQMS AQMS [CO]with = 1400 µg.m-3 [CO]without = 700 µg.m-3 [CO]measured = 1300 µg.m-3 results intercomparison: Δt = 11-12 a.m. Concentration fields (z = 3 m) with porous media without porous media
Unstructured mesh Right-side building (Leeward side) Left -side building (Windward side) POROUS MEDIUM POROUS MEDIUM Secondary traffic lane (~10% Lib. emission rate) Liberdade Av. Secondary traffic lane (~10% Lib. emission rate)
Turbulent kinetic energy (TKE) withoutporous media k (m2.s-2) Left -side building Right -side building withporous media
CO concentration CCO (µg.m-3) withoutporous media Left -side building Right -side building withporous media
Vx (m.s-1) +Vx withporous media Within the avenue-canyon, the porous medium diminishes the velocity component perpendicular to the Av. from its left to the right side +Vx Velocity x component withoutporous media Left -side building Right -side building
Vy (m.s-1) -Vy The porous medium diminishes the velocity component parallel to the Av. and in its descendant sense -Vy Velocity y component withoutporous media Left -side building Right -side building withporous media
-Vz +Vz Both negative and positive vertical velocity components within the avenue-canyon are diminished by the porous medium effect withporous media -Vz +Vz Velocity z component Vz (m.s-1) withoutporous media Left -side building Right -side building
CO concentration contours plus wind velocity streamlines CCO (µg.m-3) withoutporous media The recirculation across the street axis is still present, but the shape of the eddy has changed. Two additional vortices are formed. withporous media
CCO (µg.m-3) withoutporous media withporous media
CO concentration contours plus velocity vectors CCO (µg.m-3) withoutporous media Left -side building Right -side building Because the exchange rate of air with the atmosphere at the above roof-level is diminished and emissions are made under the trees foliage, the formation of hot-spots is increased. withporous media
CO concentration CCO (µg.m-3) withoutporous media Within these dispersion conditions a CO concentration increase is obtained at the leeward side of the Avenue when the porous media is present. withporous media
CO concentration – results sensibility to vegetation height CCO (µg.m-3) 5 m heightporous media 0 m heightporous media
CO concentration – results sensibility to vegetation height CCO (µg.m-3)
CO concentration – results sensibility to vegetation height CCO (µg.m-3) The porous media trap pollutants within the emission source lateral boundaries, sheltering the buildings from the direct impact of traffic emissions on local air quality.
CONCLUSIONS The comparison between simulated and measured values shows that, although empirical and even incomplete from a physical point of view, the approach assumed is apparentlymore close to reality than it is the absence of it. A perturbation caused by trees over the wind field should in fact exist because of the discrepancy between the “normal” simulation and the measured values, but its effect needs to be more accurately modelled.
CONCLUSIONS Apart from all the assumptions made, the results suggest that the decrease of the velocity within the porous media, and the consequent weakening of the dispersion inside the canyon, has the potential to originate undesired effects on air quality. However, these kind of ultimate effects are extremely dependent upon the local specific dispersion conditions and on the configuration and intrinsic characteristics of the vegetative canopy present. As future work, an effort will be made in order to apply an appropriate and validated model for the simulation of the perturbations induced by trees on Lisbon downtown.