Download
1 / 18
320 likes | 1.59k Vues
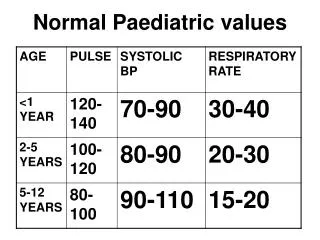
Normal cath values and shunt calculations. Agneta Geldenhuys Chris Barnard Division of Cardiothoracic Surgery Groote Schuur Hospital, UCT. Oxygen saturations. 98. 98. 70. 70. 98. 70. MVO 2 = 3SVC + 1IVC 4. Most distal chamber without L-R shunt. Hemodynamic pressures. 100/60

E N D
Normal cath values and shunt calculations Agneta Geldenhuys Chris Barnard Division of Cardiothoracic Surgery Groote Schuur Hospital, UCT
Oxygen saturations 98 98 70 70 98 70 MVO2 = 3SVC + 1IVC 4 Most distal chamber without L-R shunt
Hemodynamic pressures 100/60 (75) (8) 25/10 (15) (3) 100/ 4-8 25/ 0-3 Hemodynamic catheters with transducer at distance Micromanometre catheters
Cardiac output • Amount of blood sent to deliver enough supply for tissue oxygen demands (liters per minute) • Methods: • Dye : CO = I x 60 / Ct • Thermodilution : Catheter with lumen opening at side hole (RA) and thermister at tip (PA) • Fick
Cardiac output • Fick: oxygen uptake in lungs equals oxygen consumption in tissues • Q (l/min) = VO2 (ml/min) (O2 uptake in lungs) VA O2 diff (ml/l) (O2 consumption in tissues) • VO2 • very difficult in children • measured (Douglas bag; mass spectrometre) • Assumed (normograms: > 3 yrs: 150-160 ml/min; extrapolated for 2-3 weeks: 120-130 ml/min) • VA O2 diff = O2 content venous blood – O2 content arterial blood x ( Hb in g/dl) (1.36 ml O2/Hb) X 10 • Content = O2 carrying capacity x saturation • If Hb 14g/dl, saturation 70% • O2 carrying capacity: 140 X 1.36 = 190 ml/l • O2 content: 190 x 70% = 133 ml/l • Q (l/min) = 150-160 = 5l/min (3.2 – 7.1) (indexed 2.5l/min/m2) 20-50
Cardiac output indexed • CI = CO BSA • Mosteller: BSA (m2) = √ [height (cm) x weight (kg)] [3600] • Dubois & Dobois, Boyd • Haycock most used currently
Cardiac output and pulmonary flow • Qs= VO2 Systemic AV O2 difference • Qp= VO2 Pulmonary VA O2 difference • Qp/Qs = systemic AV O2 difference pulmonary VA O2 difference • Qp:Qs = SAO2 – MVO2 PVO2 – PAO2 MVO2 = [3SVC + 1IVC] 4
Shunts • Qp:Qs > 1 implies left-to-right-shunt • > 1.5 indication for surgery • > 2 very high • Qp:Qs < 1 implies right-to-left shunt • < 0.7 critical • < 0.3 incompatible with life • Must have FiO2 of 0.3 (> 0.3 unreliable with O2 in dissolved form)
Pulmonary vascular resistance • Ohm’s law: R = ∂P Q • PVR = mean PA pressure – mean LA pressure Qp • mmHg/l/min = Wood units • metric units: dyne.sec.cm-5 • Wood x 80 = dyne.sec.cm-5 • Normal PVR: • high at birth • approaches adult values by about 6 to 8 weeks after birth. • Normal values in children: 0 to 2 units.m2 • In a child > 1 yr: • PVRi > 6 u.m2 (cause for concern) • PVRi > 10 u.m2 (sinister)
Systemic vascular resistance • SVR = mean Aortic pressure – mean RA pressure Qs • Normal SVRi (children) : 20 units.m2 (15 – 30) • Normal SVRi (neonates): 10 units.m2, rises gradually to about 20 units.m2 by 12 to 18 months of age, gets to adult levels in teenage yrs
Pulmonary vascular reactivity • Predicting favourable biventricular repair: • PVRi < 6 Wood units.m2 • Resistance ratio (PVR:SVR) < 0.3 (ratio more accurate) • If PVRi 6 – 9, Resistance ratio 0.3 – 0.5: • Vasoreactivity testing (100% O2 or NO 20-80 ppm): • ≥ 20% decrease in PVRi • ≥ 20% decrease in PVR:SVR • Final PVRi < 6 Wood units.m2 • Final PVR:SVR < 0.3
Pulmonary vascular reactivity • For Fontan: • Near normal PVRi (≤ 3 Wood units.m2) • Mean PAP < 15 mmHg
McGoon • McGoon = RPA diam + LPA diam aorta diam (diaph) • Systole • Normal 2.1 • > 1.5 : acceptable predicted RV systolic pressure post TOF repair • > 1.2 : controversial • > 0.8 : PA / VSD with only RVOT reconstruction
Transpulmonary gradient • TPG = PA mean pressure – LA mean pressure • PCWP for LA mean (LVEDP) • Mean TPG: 6 • Transplant < 12 • Fontan: • Low TPG • Historic era of accepting higher pressures • Baghetti: can inoperable Fontans become operable?
References • Baim DS. Grossmann’s Cardiac catheterisation, angiography and intervention. Lippincott, Williams & Wilkins. 7th ed. 2006 • Beghetti M, Galie N, Bonnet D. Can “inoperable” congenital heart defects become operable in patients with pulmonary arterial hypertension? Dream or reality? Congenit Heart Dis. 2012;7:3-11 • Lopes AA, O’Leary PW. Measurement, interpretation and use if haemodynamic parameters in pulmonary hypertension associated with congenital heart disease. Cardiol Young 2009;19:431-435 • Selke FW, Del Nido PJ, Swanson SJ. Sabiston and Spencer’s Surgery of the Chest. Saunders Elsevier. 8th ed. 2011 • Wilkinson JL. Haemodynamic calculations in the catheter laboratory. Heart 2001;85:113-120