Using Loss Pairs to Discover Network Properties
190 likes | 330 Vues
This paper explores network characteristics during packet loss events, specifically focusing on the state of the network when packets are dropped. By introducing the concept of "Loss Pairs," the authors propose a method to infer network conditions and buffer occupancy from non-dropped packets that are close in time to dropped packets. Key assumptions include stability of bottleneck paths and FCFS scheduling. Through simulations, they demonstrate the efficacy of this technique in estimating queue management schemes and buffer sizes in various network settings, providing valuable insights for application adaptation and network debugging.

Using Loss Pairs to Discover Network Properties
E N D
Presentation Transcript
Using Loss Pairs to Discover Network Properties Jun Liu, Mark Crovella Computer Science Dept. Boston University
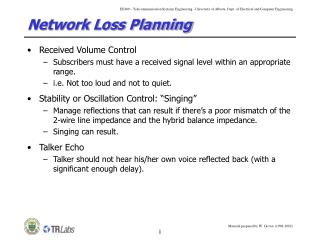
Discovering Network Properties What is the state of the network when packets are being dropped? E.g., What is the buffer occupancy when packets are being dropped? • For a DropTail queue, indicates buffer size; • For an AQM queue, indicates dropping policy.
Benefits and Difficulties • Why is this useful? • Characterizing existing networks; • Using information gained to adapt applications to network status; • Debugging network elements. • Why is this hard? • Dropped packets carry no information to the endpoint; • Noisy measurements require robust estimation methods.
The Basic Idea • A packet traveling close to a dropped packet sees similar network state as the dropped one. • We propose a method called Loss Pairs to characterize the dropping function of a network element under some assumptions.
Loss Pairs • A non-dropped packet that is close to a dropped packet can inform the endpoint about network state seen by the dropped packet. • We define a loss pair as two packets p1 and p2 such that • p2 initially follows p1 with time between the trailing edge of p1 and the leading edge of p2; • Exactly one of p1 and p2 happens to be dropped in the network; • p1 and p2 traverse the same sequence of links and routers up to the point one is dropped. • Generally, we consider to be0.
Assumptions For Using Loss Pairs in Practice • Most of the packet losses and delays happen at the bottleneck. • The round-trip path and the bottleneck stay stable during measurement. • To estimate queue state, packet scheduling must be FCFS. • To convert queue occupancy to bytes, bottleneck bandwidth must be known.
D B A C Network Setting For Evaluation • We consider a 3-hop sample network setting. • Capable of varying cross traffic upstream, downstream and at the bottleneck. • Workload : heavy tailed ON/OFF TCP sources. • Goal : Characterize the queue between B and C by passive measurements taken at the sender. Bottleneck Cross Traffic Upstream Cross Traffic Downstream Cross Traffic Bottleneck Link Visable Traffic
Varying Buffer Size Of A DropTail Router • The queue state seen by a dropped packet is a linear function of buffer size.
Estimating Buffer Size of DropTail Routers • Tq = the most common RTT of Loss Pairs. • Tp = minimum RTT of all non-dropped packets. • C = link bandwidth of the bottleneck link • Buffer size = C * (Tq – Tp)
Filtering Ability of Loss Pairs Normal RTT RTT of Loss Pairs Corresponds to full buffer Corresponds to empty buffer
Estimation Accuracy UnderLight Cross Traffic • Each crossing path has 1/10th the sources of the main path. • The estimation results are quite good -- all assumptions are met.
Estimation Accuracy UnderModerate Cross Traffic • Each crossing path has 50% of the sources of the main path. • Estimation results are still acceptable -- assumptions are partially met. • Queue delays in non- bottleneck queues are prominent for small buffer sizes.
Estimation Accuracy Under Heavy Cross Traffic • Each crossing path has as many sources as the main path. • Estimation results are poor for small buffers -- assumptions are violated. • However, the results are acceptable on large buffers.
Effect of Cross Traffic • Heavy cross traffic upstream , downstream or on return path affects accuracy. • Cross traffic at the bottleneck doesn’t affect accuracy -- only affects the number of samples on Loss Pairs.
Characterizing Dropping Curves of AQM Routers • New assumption : packet drops are independent. • Estimation Method:# loss pairs with RTT = x Dropping ratio = ------------------------------- # trial pairs with RTT = x • A trial pair with RTT = x is a pair of packets with at least one packet not having been dropped.
Characterizing the Dropping Curve of a RED Router Parameters: min_threshold=9KB, max_threshold=18KB, Mp=0.1 Measured By Loss Pairs Actual Behavior
Characterizing the Dropping Curve of a BLUE Router • Parameters:B=500 pkts, Incr=Decr=0.0025, Holding time = 0.01 sec.
Related Work • Measurement of bandwidth by Packet Pairs • Keshav (1991), Bolot (1993), Paxson (1995), Carter & Crovella (1996, Bprobe) • Measurement of bandwidth, delay, mean queue occupancy, etc. by individual packet • Jacobson (1997, pathchar), Downey (1999, pchar), Mah (1999, clink), Lai and Baker (2000), Harfoush et al. (2001) • Measurement of loss rate • Duffield et. al. (1999, MINC) • Harfoush et. al. (2000, MINT)
Conclusion • We propose a new technique for characterizing the packet dropping behavior of network elements. • By simulation, we have shown that this method is effective in characterizing the dropping patterns of routers. • This method can be used to characterize the queue management scheme being used at the bottleneck link. • For DropTail queues, this method can be used to determine router buffer size.