Analyzing Ireland's Growth Accounting and Labour Market Dynamics Post-1995
210 likes | 333 Vues
This analysis delves into Ireland's economic transformation, focusing on growth accounting and labour market strategies. It highlights the transition in Total Factor Productivity (TFP) growth from stagnation between 1973-1995 to a resurgence post-1995. Key factors include increased investment, booming employment, competitive wages, and multinational engagement. Insights are drawn from the modelling of economic behaviours, wedge accounting, and demographic trends. Understanding these elements is crucial for comprehending Ireland’s rapid growth and the implications for future economic policies.

Analyzing Ireland's Growth Accounting and Labour Market Dynamics Post-1995
E N D
Presentation Transcript
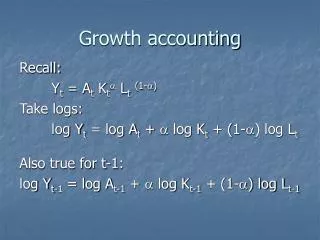
Growth accounting Recall: Yt = At Kta Lt(1-a) Take logs: log Yt = log At + a log Kt + (1-a) log Lt Also true for t-1: log Yt-1 = log At-1 + a log Kt-1 + (1-a) log Lt-1
Growth accounting (log Yt - log Yt-1) = (log At - log At-1) + a (log Kt -log Kt-1) + (1-a)(log Lt - log Lt-1) % Yt = % At + a% Kt + (1-a)% Lt Rearrange to get: % At = % Yt - a% Kt - (1-a)% Lt
Growth accounting We have data on Y, K and L (1-a) = labour’s share of income = wL/Y 0.6 (on average) Thus a 0.4 A is the “Solow” residual
Labour input • Labour input measured by total hours worked (L) • L = average workweek employment
Main points: • Ireland’s TFP growth slowed between 1973-1995, but picked up post-1995 • Investment also picked up post-1995 • Especially impressive boom in employment • Probably even bigger contribution from labour input if labour quality adjusted.
Labour demand • Competitive wages (w/A) • Foreign multinationals using Ireland as an export platform • EU internal market • Low corporation tax • Highly educated, English-speaking workforce • Flexible labour markets • IDA policy; agglomeration effects • Expanding services sectors • Boom in construction industry
Labour supply • Natural demographic effects • Figures 1, 2 & 3 in Fitz Gerald (2004) • Low dependency ratio • Total fertility rate = 2! (EU average = 1.5) • Participation rates • Migration
Labour supply National Competitiveness Council, Annual Competitiveness Report 2005 • http://www.forfas.ie/ncc/reports/ncc_annual_05/ch03/ch03_01.html Central Statistic Office • http://www.cso.ie
Wedge accounting • Ahearne, Kydland, Wynne, (2005) “Ireland’s Great Depression” • Ireland experienced a great depression in the 1980s • Study the contribution of different wedges to the downturn and subsequent recovery
Model economy • Computer model of the Irish economy • Explicitly model behaviour of agents • Households make choices about how much to consume/save and how much to work • Firms maximize profits • Agents are forward looking
“Wedge” accounting • Basic idea: • Examine movements in wedges or distortions to account for cyclical episodes • Applications: • Accounting for the (US) Great Depression • Accounting for 1990-91 (US) recession
Definitions • Efficiency wedge • Essentially TFP • Labor wedge • Distorts (intratemporal) labor-consumption decision • Investment wedge • Distorts (intertemporal) investment decision • Government consumption wedge
Consumption A B Nonmarket activity Efficiency wedge
Consumption A B Nonmarket activity Labor wedge
Future Consumption A B Current Consumption Capital wedge
Government consumption wedge • Unproductive government spending • Resource constraint Yt =Ct + It + Gt + Xt - Mt
Results • Efficiency wedge by itself does a good job accounting for downturn and recovery, though predicts an earlier recovery • Labour wedge predicts an even more severe downturn, but no recovery • Investment and government wedges cannot account for downturn and recovery
Convergence or Regional Boom? • Barry (2002) • Rapid growth in 1990s was a regional boom • Region very open labour markets • If good shock hits region boom • Ireland’s case: FDI • Bad shocks can lead to a reversal!