Quality Concepts
Quality Concepts. Prof G Sinha VGSOM, IIT Kharagpur. Defining Quality. The totality of features and characteristics of a product or service that bears on its ability to satisfy stated or implied needs. American Society for Quality. Different Views.

Quality Concepts
E N D
Presentation Transcript
Quality Concepts Prof G Sinha VGSOM, IIT Kharagpur
Defining Quality The totality of features and characteristics of a product or service that bears on its ability to satisfy stated or implied needs American Society for Quality
Different Views • User-based – better performance, more features • Manufacturing-based – conformance to standards, making it right the first time • Product-based – specific and measurable attributes of the product
Customer-DrivenDefinitions of Quality • Conformance to Specifications • Value • Fitness for Use • Support • Psychological Impressions
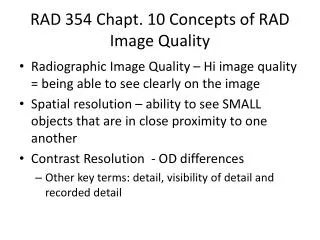
Quality Specifications • Design quality: Inherent value of the product in the marketplace • Dimensions include: Performance, Features, Reliability/Durability, Serviceability, Aesthetics, and Perceived Quality. • Conformance quality: Degree to which the product or service design specifications are met
Implications of Quality • Company reputation • Perception of new products • Employment practices • Supplier relations • Product liability • Reduce risk • Global implications • Improved ability to compete
Performance Features Reliability Conformance Durability Serviceability Aesthetics Perceived quality Value Key Dimensions of Quality
Evolution of Quality Management • 1924 - Statistical process control charts • 1930 - Tables for acceptance sampling • 1940’s - Statistical sampling techniques • 1950’s - Quality assurance/TQC • 1960’s - Zero defects • 1970’s - Quality assurance in services
Leaders in Quality W. Edwards Deming 14 Points for Management Joseph M. Juran Top management commitment, fitness for use Armand Feigenbaum Total Quality Control Philip B. Crosby Quality is Free
Deming’s Fourteen Points • Create consistency of purpose • Lead to promote change • Build quality into the product; stop depending on inspection • Build long term relationships based on performance, not price • Continuously improve product, quality, and service • Start training • Emphasize leadership Table 6.1
Deming’s Fourteen Points • Drive out fear • Break down barriers between departments • Stop haranguing workers • Support, help, improve • Remove barriers to pride in work • Institute a vigorous program of education and self-improvement • Put everybody in the company to work on the transformation Table 6.1
TQM Encompasses entire organization, from supplier to customer Stresses a commitment by management to have a continuing, companywide drive toward excellence in all aspects of products and services that are important to the customer
Total Quality Management A philosophy that involves everyone in an organization in a continual effort to improve quality and achieve customer satisfaction. T Q M
Total Quality Management (TQM) • Total quality management is defined as managing the entire organization so that it excels on all dimensions of products and services that are important to the customer
The TQM Approach • Find out what the customer wants • Design a product or service that meets or exceeds customer wants • Design processes that facilitates doing the job right the first time • Keep track of results • Extend these concepts to suppliers
Elements of TQM • Continual improvement • Competitive benchmarking • Employee empowerment • Team approach • Decisions based on facts • Knowledge of tools • Supplier quality • Champion • Quality at the source • Suppliers
Continuous Improvement • Philosophy that seeks to make never-ending improvements to the process of converting inputs into outputs. • Kaizen: Japanese word for continuous improvement.
Quality at the Source The philosophy of making each worker responsible for the quality of his or her work.
Product/service design Product/service design Process design Process design Continuous improvement Continuous improvement Employee involvement Employee involvement Customer satisfaction Customer satisfaction Problem-solving tools Problem-solving tools Purchasing Purchasing Benchmarking Benchmarking TQMWheel Figure 5.2
Appraisal Costs External Failure Costs Prevention Costs Internal FailureCosts Costs of Quality Costs of Quality
Plan Identify the improvement and make a plan 4. Act Implement the plan 3. Check Is the plan working? 2. Do Test the plan Shewhart’s PDCA Model Figure 6.3
Nominal value Process distribution Lower specification Upper specification Minutes 20 25 30 Process Capability (a) Process is capable Figure 5.12
Nominal value Process distribution Lower specification Upper specification Minutes 20 25 30 Process Capability (b) Process is not capable Figure 5.12
Nominal value Six sigma Four sigma Two sigma Lower specification Upper specification Mean Process Capability Figure 5.13
Upper specification - Lower specification 6s Cp = = x – Lower specification 3s , Cpk = Minimum of = Upper specification – x 3s Process Capability Process Capability Ratio Process Capability Index
Process Capability Intensive Care Lab Upper specification = 30 minutes Lower specification = 20 minutes Average service = 26.2 minutess = 1.35 minutes Example 5.5
= x – Lower specification 3s , = Upper specification – x 3s Process Capability Intensive Care Lab Upper specification = 30 minutes Lower specification = 20 minutes Average service = 26.2 minutess = 1.35 minutes Cpk = Minimum of Process Capability Index Example 5.5
Cpk = Minimum of 26.2 – 20.0 3(1.35) , 30.0 – 26.2 3(1.35) Process Capability Intensive Care Lab Upper specification = 30 minutes Lower specification = 20 minutes Average service = 26.2 minutess = 1.35 minutes Process Capability Index Example 5.5
Cpk = Minimum of 1.53, 0.94 Process Capability Intensive Care Lab Upper specification = 30 minutes Lower specification = 20 minutes Average service = 26.2 minutess = 1.35 minutes Process Capability Index Example 5.5
Upper specification - Lower specification 6s Cp = Process Capability Intensive Care Lab Upper specification = 30 minutes Lower specification = 20 minutes Average service = 26.2 minutess = 1.35 minutes Cpk = 0.94 Process Capability Index Process Capability Ratio Example 5.5
30 - 20 6(1.35) Cp = Process Capability Intensive Care Lab Upper specification = 30 minutes Lower specification = 20 minutes Average service = 26.2 minutess = 1.35 minutes Cpk = 0.94 Process Capability Index Process Capability Ratio Example 5.5
Process Capability Intensive Care Lab Upper specification = 30 minutes Lower specification = 20 minutes Average service = 26.2 minutess = 1.35 minutes Cpk = 0.94 Cp = 1.23 Process Capability Index Process Capability Ratio Example 5.5
Cpk = 1.08 Cp = 1.39 After process modification Process Capability Intensive Care Lab Upper specification = 30 minutes Lower specification = 20 minutes Average service = 26.1 minutess = 1.20 minutes Process Capability Index Process Capability Ratio Example 5.5
Six Sigma Quality • A philosophy and set of methods companies use to eliminate defects in their products and processes • Seeks to reduce variation in the processes that lead to product defects • The name, “six sigma” refers to the variation that exists within plus or minus three standard deviations of the process outputs
Six Sigma Quality (Continued) • Six Sigma allows managers to readily describe process performance using a common metric: Defects Per Million Opportunities (DPMO)
Six Sigma Quality (Continued) So, for every one million letters delivered this city’s postal managers can expect to have 1,000 letters incorrectly sent to the wrong address. Example of Defects Per Million Opportunities (DPMO) calculation. Suppose we observe 200 letters delivered incorrectly to the wrong addresses in a small city during a single day when a total of 200,000 letters were delivered. What is the DPMO in this situation? Cost of Quality: What might that DPMO mean in terms of over-time employment to correct the errors?
Six Sigma Quality: DMAIC Cycle • Define, Measure, Analyze, Improve, and Control (DMAIC) • Developed by General Electric as a means of focusing effort on quality using a methodological approach • Overall focus of the methodology is to understand and achieve what the customer wants • A 6-sigma program seeks to reduce the variation in the processes that lead to these defects • DMAIC consists of five steps….
Six Sigma Quality: DMAIC Cycle (Continued) 1. Define (D) Customers and their priorities 2. Measure (M) Process and its performance 3. Analyze (A) Causes of defects 4. Improve (I) Remove causes of defects 5. Control (C) Maintain quality
Example to illustrate the process… • We are the maker of this cereal. Consumer reports has just published an article that shows that we frequently have less than 15 ounces of cereal in a box. • What should we do?
Step 1 - Define • What is the critical-to-quality characteristic? • The CTQ (critical-to-quality) characteristic in this case is the weight of the cereal in the box.
2 - Measure • How would we measure to evaluate the extent of the problem? • What are acceptable limits on this measure?
2 – Measure (continued) • Let’s assume that the government says that we must be within ± 5 percent of the weight advertised on the box. • Upper Tolerance Limit = 16 + .05(16) = 16.8 ounces • Lower Tolerance Limit = 16 – .05(16) = 15.2 ounces
2. Measure (continued) • We go out and buy 1,000 boxes of cereal and find that they weight an average of 15.875 ounces with a standard deviation of .529 ounces. • What percentage of boxes are outside the tolerance limits?
Process Mean = 15.875 Std. Dev. = .529 Upper Tolerance = 16.8 Lower Tolerance = 15.2 What percentage of boxes are defective (i.e. less than 15.2 oz)? Z = (x – Mean)/Std. Dev. = (15.2 – 15.875)/.529 = -1.276 NORMSDIST(Z) = NORMSDIST(-1.276) = .100978 Approximately, 10 percent of the boxes have less than 15.2 Ounces of cereal in them!
Step 3 - Analyze - How can we improve the capability of our cereal box filling process? • Decrease Variation • Center Process • Increase Specifications
Step 4 – Improve – How good is good enough?Motorola’s “Six Sigma” • 6s minimum from process center to nearest spec
Motorola’s “Six Sigma” • Implies 2 ppB “bad” with no process shift • With 1.5s shift in either direction from center (process will move), implies 3.4 ppm “bad”.
Step 5 – Control • Statistical Process Control (SPC) • Use data from the actual process • Estimate distributions • Look at capability - is good quality possible • Statistically monitor the process over time
Analytical Tools for Six Sigma and Continuous Improvement: Flow Chart No, Continue… Material Received from Supplier Inspect Material for Defects Defects found? Yes Can be used to find quality problems Return to Supplier for Credit