Download
1 / 20
200 likes | 223 Vues
Explore sensor deployment methods and challenges in monitoring very high suspended particulate matter, including sensor calibration, deployment systems, and long-term observations. Investigate optical and acoustic sensors to study SPMC characteristics like concentration, particle size, and organic fraction.

E N D
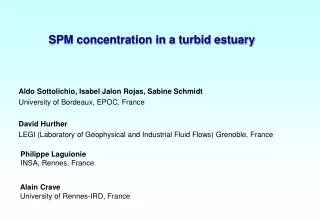
SPM concentration in a turbid estuary Aldo Sottolichio, Isabel Jalon Rojas, Sabine Schmidt University of Bordeaux, EPOC, France David Hurther LEGI (Laboratory of Geophysical and Industrial Fluid Flows) Grenoble, France Philippe Laguionie INSA, Rennes, France Alain Crave University of Rennes-IRD, France
What sensors do you use in monitoring, any other long-term observations and other ship surveys? optical OBS 3A Endress & Hauser TSBD NKE acoustic ADV Nortek (ADCP)
Type of observing systems: profiler on ships, poles, mooring stations … Typical deployment time of your systems? from 13h to several months Location of deployments: near-bed, near-channel
Long term monitoring Jalon Rojas et al, 2015, HESS
Long term monitoring Jalon Rojas et al, 2015, HESS
Calibration in the laboratory Calibrated in the range 0,1-300 g.l-1 with natural Gironde mud Optical Backscattering Sensor saturation zone (15-30 g.l-1)
Calibration in the laboratory Argus Surface Meter ASM-IV Total length 1,44m Vertical resolution of 1cm Temporal sampling rate 0,33 Hz
Calibration in the laboratory Calibrated in the range 0,4-80 g.l-1 with natural Gironde mud Argus Surface Meter ASM-IV
Calibration in the laboratory Acoustic Doppler Velocimeter Vector ADV Intensity Calibrated with samples of natural mud SNR Empirical relations for C<5.5 g.-l and for C>5.5 g.l-1
Calibration in the laboratory STBD NKE
marée turbidité brute inversion with first part inversion with low part
Experiment 2 (nov 2005) Comparison between C-ASM and C-ADV from water samples
Experiment 3 (nov 2005) Comparison between C-ASM and C-ADV from water samples
Characteristics of the SPM at your locations (concentration, floc/particle size, organic fraction, mineralogy, ....)? Organic fraction : 2-10% Floc size : difficult to determine Particle size: only in lab (10 µm)
LISST measurementsalongthe estuary (Marchal, 2014)
Conclusions • High SPMC: • - imited knowledge on in-situ particle charactetistics • (limited instrumentation) • ambiguity of bacscattering signal • easy to solve in a vertical profile • difficult to solvewith one single probe