Download
1 / 31
310 likes | 326 Vues
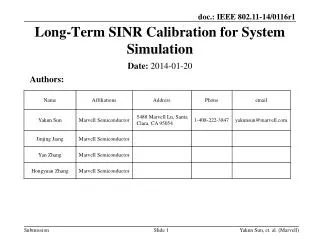
Motivation Configuration Results. Long-term statistics of continuous single-column model simulation at Cabauw. Roel Neggers Pier Siebesma thanks to many others at KNMI. Idealized observed situations, considered typical for a specific weather regime

E N D
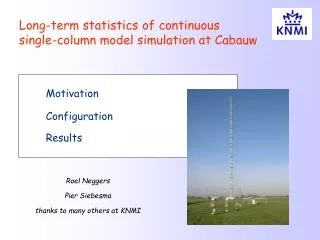
Motivation Configuration Results Long-term statistics of continuous single-column model simulation at Cabauw Roel Neggers Pier Siebesma thanks to many others at KNMI
Idealized observed situations, considered typical for a specific weather regime Evaluation against observations and LES simulations SCM case studies (GCSS BLCWG, ARM CMWG) Dry CBL Wangara GABLS3 Stratocumulus FIRE ASTEX DYCOMS M-PACE Shallow cumulus BOMEX ATEX SCMS RICO ARM SGP Deep cumulus TOGA COARE LBA ARM SGP TWP-ICE Purpose: improvement of the parameterization of fast sub-grid processes (e.g. turbulence, convection, clouds, radiation) Advantages: computational efficiency & model transparency
Potential issues: i) How representative are these idealized situations? ii) Parameterizations might get calibrated to rare situations iii) Do the available cases represent those situations where GCMs have most trouble / uncertainty ? Q: How can we improve/ensure the statistical significance and relevance of SCM simulations? This question is relevant for both GCSS and CFMIP: GCSS: to better connect to GCM problems CFMIP: need for insight at process level
Continuous SCM evaluation – The Cabauw SCM Testbed Purpose: Daily SCM simulation at Cabauw for long, continuous periods of time Evaluation of long-term statistics against observational datastreams
The idea * Short-range (3 day) SCM simulations are generated daily for Cabauw Method: a combination of prescribed large-scale forcing and nudging towards a background state (observed/forecast/reanalysis) * Build up a long (multi-year) archive of simulations Allows diagnosing monthly/yearly statistics: i) improved statistical significance (representativeness) ii) many different weather regimes are automatically captured iii) a fair comparison with similarly diagnosed GCM statistics * Comprehensive evaluation of the complete parameterized system against Cabauw observations Covering thermodynamics, momentum, radiation, clouds, soil, etc. Allows constraining all parameterizations simultaneously should reveal compensating errors in GCMs
The Cabauw site Operated by KNMI Operational since 1972 Tower height: 213m Main scientific goals: * Atmospheric research (PBL) * Climate monitoring * Air pollution monitoring * Model evaluation Cabauw is a site http://www.cesar-observatory.nl/
What are the strong points of Cabauw for model evaluation? * The number of operational instruments * Continuity of measurement * Long time-coverage * High sampling frequency * A well-organized data archive that is easily accessible (CESAR)
Individual cases Example: a diurnal cycle of shallow cumulus convection ◊ : CT75 lowest cloud base
Evaluation strategy 1) Statistically identify a problem in a GCM Long-term GCM statistics guide the evaluation effort 2) Assess if the problem is reproduced by the corresponding SCM Exactly matching the GCM statistics(monthly/yearly means) 3) If so, identify which individual days contribute most to the error Selected individual cases are guaranteed to matter 4) Study those days in great detail, using a variety of statistical tools 5) When the cause is identified and understood, formulate a solution 6) Re-simulate and re-evaluate the modified SCM 7) Rerun the GCM including the improved physics 3D 1D 3D
Example Addressing a summertime diurnal warm bias over land in a GCM An issue encountered during the implementation of a new shallow cumulus scheme into the ECMWF IFS EDMF-DualM Eddy Diffusivity Mass Flux scheme Teixeira and Siebesma, AMS BLT proceedings, 2000 Siebesma et al., JAS 2007 Dual mass flux framework Neggers et al., JAS 2009, June issue
Step I: The GCM problem ECMWF IFS difference in summertime diurnal cloud cover between CY32R3 + EDMF-DualM and CY32R3 free climate run, June-July 2008 Thanks to Martin Köhler, ECMWF
A differencein daily mean 2m temperature over land free climate run, June-July 2008
Hypothesis: SW 1. less PBL clouds 4. low level warming 2. larger SW down 3. larger H Q: can the Cabauw SCM Testbed provide some evidence?
CY31R1 CY31R1 Step II: Do the SCMs reproduce the GCM behavior? cloud cover at noon differs by ~20% 2m T differs by ~0.5K
CY31R1 CY31R1 Related monthly-mean differences support our hypothesis ~50 W/m2 (Note: there are still some issues with this observational datastream)
CY31R1 CY31R1 Step III: Conditional averaging a) clear convective days in May 2008 Important result: model differences are gone! -> proof that clouds are the cause
CY31R1 CY31R1 b) shallow cumulus days in June 2008 Differences amplify –> this regime is the cause ~100 W/m2 CY31R1 is too optically thick, while DualM is too transparent
CY31R1 Step IV: Zooming in on single days Which days contribute most to the monthly-mean differences?
17 June 2008 CY31R1 CY31R1 tends to produce anvils at the top of the cumulus PBL dualM_20080429_buoysort
Different tendency to form cumulus anvils is caused by differences in the vertical structure of model mass flux: Non-mixing; Fixed structure Mixing; Flexible structure M M Tiedtke (1989) in IFS EDMF-DualM
CY31R1 CY31R1 Step VI: Modified SCM Now that we understand the problem, we can make targeted changes Much better SW down 2mT bias has reduced Note: it has not completely disappeared
dualM_20080429_buoysort CY31R1 The plot thickens… The surface Bowen ratio (H/LE) A significant monthly-mean difference!
dualM_20080429_buoysort CY31R1 What can change the surface Bowen ratio? Could it be the surface precipitation?
20 June 2008 a diurnal cycle of shallow cumulus convection cloud fraction CY31R1 precipitation flux CY31R1
dualM_20080429_buoysort CY31R1 CY31R1 shallow cumulus surface rain is i) stronger and ii) more intermittent Note: no rain was observed dualM_20080429_buoysort CY31R1 This boosts the interception reservoir (a.k.a. “skin humidity”) dualM_20080429_buoysort CY31R1 This actively increases the surface latent heat flux, at the cost of the sensible heat flux
We have to refine our hypothesized impact mechanism: it’s more complex, involving both a cloud-radiative feedback as well as an atmosphere-land feedback SW larger SW down 1. less PBL clouds low level warming 2. less surface precip larger H higher rBowen
dualM_20080429_buoysort - Pboost dualM_20080429_buoysort CY31R1 dualM_20080429_buoysort - Pboost dualM_20080429_buoysort CY31R1 Sensitivity experiment: Re-run DualM for June 2008 with an artificially boosted surface precipitation supply to the soil model
Step VII: Modified GCM Monthly mean SCM results translate to IFS: A beneficial impact on 2m T over land!
Summary It is possible to reproduce long-term statistics of GCM behavior with continuous daily SCM simulation Identifying the individual cases that contribute most to the time-mean SCM error ensures we study the most relevant situations Using the Cabauw SCM Testbed we were able to understand and address several important issues encountered during the implementation of a new shallow cumulus scheme into the ECMWF IFS Conditional averaging can be a helpful tool in understanding model behavior The availability of continuous, long-term observations of all components of the parameterized system is essential The SCM testbed method can be used to identify and improve interactions between climate system components in GCMs
Outlook Top priority: to make the testbed server publicly accessible More SCMs ECHAM5 HIRLAM/AROME/HARMONIE UK MetOffice COSMO More locations Cloudnet sites ( Chilbolton, Lindenberg ), ARM sites More observational datastreams Nubiscope, UV lidar, soil measurements, profiler Improved spatial coverage Surface instrument networks, satellite datasets, scanning radar Score metrics (RMS, Brier scores)