Download
1 / 22
220 likes | 231 Vues
GUS integrates sequence and annotation data, incorporates biological knowledge, and provides a foundation for gene network analysis.

E N D
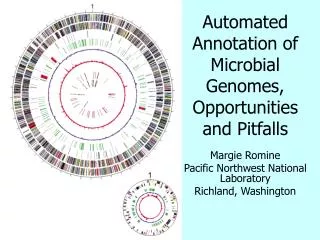
Information Management Infrastructure for the Systematic Annotation of Vertebrate Genomes V Babenko (1), B Brunk (1), J Crabtree (1), S Diskin (1), Y Kondrahkin (1), J Mazzarelli (1), S McWeeney (1), D Pinney (1), A Pizzaro (1), J Schug (1), V Bogdanova (2), A Katohkin (2), V Nadezhda (2), E Semjonova (2), V Trifonoff (2), N Kolchanov (2), M Bucan (3), C Stoeckert (1) 1Center for Bioinformatics, University of Pennsylvania, Philadelphia, PA, 2Institute for Cytology and Genetics, Novosibirsk, Russia, 3Department of Psychiatry, University of Pennslyvania, Philadelphia, PA
Goals • Database Infrastructure: Integrate sequence and sequence annotation according to biologically-relevant relationships. • Annotation Pipeline: Incorporate biological knowledge. • Data Access and Mining: Provide a foundation for building gene networks.
Database Infrastructure: Genomics Unified Schema (GUS) free text under development Control. Vocabs. • Genes, gene models • STSs, repeats, etc • Cross-species analysis Genomic Sequence • GO • Species • Tissue • Dev. Stage RAD RNA Abundance DB • Characterize transcripts • RH mapping • Library analysis • Cross-species analysis • DOTS Transcribed Sequence Special Features • Arrays • SAGE • Conditions Transcript Expression • Ownership • Protection • Algorithm • Evidence • Similarity • Versioning • Domains • Function • Structure • Cross-species analysis Protein Sequence Pathways Networks • Representation • Reconstruction Davidson et al. IBM Systems Journal 2001
Database Infrastructure: GUS Object View Gene Genomic Sequence Gene Instance Gene Feature NA Feature NA Sequence RNA RNA Sequence RNA Instance RNA Feature Protein Protein Sequence Protein Instance Protein Feature AA Sequence AA Feature
Database Infrastructure: GUS Architecture External Datasources Data Integration Computational Annotation Validation Light weight PERL object layer Data Warehouse ~230 Tables/Views Annotators interface Browser & bioWidgets Java Servlet (views)
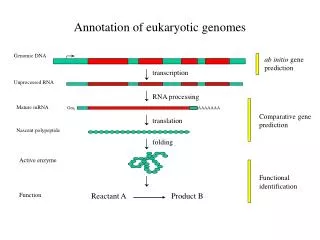
Annotation Pipeline: Diagram of GUS Computed & Manual Annotation Genomic Sequence mRNA/EST Sequence Clustering and Assembly Gene predictions GRAIL/GenScan BLAST/SIM4 Predicted Genes DoTS consensus Sequences Merge Genes Gene/RNA cluster assignment Annotate DoTS Manual Annotation Tasks Gene Index framefinder RNAs Proteins translation BLASTX PFAM, Smart, ProDom BLASTP Other computed annotation (EPCR, AssemblyAnatomyPercent, Index Key Words, SNP analysis) BLAST Similarities Functional predictions Protein Motifs GO Functions
Annotation Pipeline: Transcript Clusters and Assemblies UniGene Transcribed Sequences (DOTS) CAP4: Consensus Sequences -Alternative splicing -Paralogs BLAST: Clusters of ESTs & mRNAs
Annotation Pipeline: GO Function Predictions • Based on GO Function Ontology Version: 2.155 • GO Associations Downloaded: December 18, 2001 (yeast, fly, mouse, and human) • ProDom version: 2001.1; CDD: downloaded June 28, 2001 • Rules Generated: December 20, 2001; 20529 domains w/GO function associations • Applied to Mouse assemblies: 34% Coverage of mouse “genes” with sim. to nrdb
Annotation Pipeline: Input and output statistics For Chr. 21 and 22 only
Annotation Pipeline: Assembly Validation • Alignment to Genomic Sequence via Blast/sim4. • preliminary data look good • Assembly consistency (Assemblies provide potential SNPs)
Annotation Pipeline: “Good” Translated Assemblies P-value is assigned based on translation length relative to assembly length. Can be used to help identify true coding regions.
Data Access and Mining: http://www.allgenes.org Queries Gene trap insertions Annotated gene name Manually reviewed Chromosomal location Genome location Where expressed dbEST library # of assembly sequences GO function Keyword search GenBank accession IMAGE clone ID Boolean And/Or to 3 levels History Union/Intersection/Subtraction
Data Access and Mining: RNA Report ESTs and mRNAs are clustered and assembled based on sequence similarity to generate a consensus RNA. These “RNAs” are clustered by sequence similarity to generate “Genes.” Predicted Gene Ontology molecular function. Genomic alignments for human assemblies. Chromosomal location according to RH map of constituent ESTs. BLASTX against NRDB to identify protein similarities. Not Shown: BLASTX against Prodom and CDD to identify functional domains and motifs. Gene Trap Insertions. CAP4 consistency score.
Data Access and Mining: dbEST Libraries Mapped to Anatomy Hierarchy
Data Access and Mining: Alignment of RNAs (Assemblies) on Genomic Sequence
Data Access and Mining: Bridging Fingerprint Contigs and RH Maps on Mouse Chromosome 5 Fingerprint Map Chr. 5 RH Map Crabtree et al. Genome Research 2001
Data Access and Mining: Integration with Other Projects Sequence & annotation Gene index (ESTs and mRNAs) Microarray expression data experimental annotation Relational DB (Oracle) with Perl object layer GUS RAD
Data Acces and Mining: Integration of Micorarrays, ESTs, and Genomic Sequences Identify shared TF binding sites Genomic alignment and comparative Sequence analysis TESS (Transcription Element Search Software) PROM-REC (Promoter recognition) GUS RAD EST clustering and assembly
Plans • Annotate promoters and transcription factor binding sites. • Genomic alignments for mouse assemblies and comparisons to human. • Rules for expression in different tissues based on EST library source and microarray data
AllGenes (http://www.allgenes.org) is a human and mouse view of the GUS (Genomics Unified Schema) relational database and includes a gene index generated by assembly of publicly available EST and mRNA sequences. The assemblies integrate annotation from cDNA libraries, RH mapping data, and gene trap insertions. Automated annotation has been applied to characterize these sequences and relate them along with their predicted protein sequences to conceptual genes. The gene index contains over 3 million human and nearly 2 million mouse ESTs and mRNAs as of September, 2001 that have clustered into 150,006 human and 74,024 mouse "genes" (a new build of the index is underway). Approximately half the human and mouse genes have similarity to a known protein sequence and of these, we have been able to predict a Gene Ontology (GO) molecular function for 31% of the human and 45% of the mouse genes. Manual annotation is used to better structure the data (e.g., assign libraries to an anatomy ontology), confirm automated annotation (e.g., check GO assignments), and add new information (e.g., assign gene symbols and synonyms). Nearly 2000 human and mouse assemblies have been manually reviewed as of October, 2001 and this number is expected to greatly increase. Incorporation of genomic sequences will provide better assessment of the assemblies as genes and guide discovery of new genes and transcript alternative forms. The UCSC Golden path contigs are being used in this context with a focus on chromosome 22 of algorithmic and manual analysis. A related site on mouse chromosome 5 (http://www.cbil.upenn.edu/mouse/chromosome5/) integrates the assemblies with existing genomic resources (e.g., BAC fingerprint, RH, and genetic maps) to facilitate functional analyses. The source and ownership of all data, algorithms run on it and evidence for assertions such as GO function predictions are stored in GUS allowing users to assess the validity of the data. The GUS schema is organized around the central dogma of biology (genes are transcribed to RNA which are translated to proteins) enabling a powerful query web interface. Users can build queries using Boolean functions to identify data sets for browsing and further analysis. The sequences, their contained accessions, predicted protein translations and predicted GO functions can be downloaded at the AllGenes site.
Incremental Updates of DoTS Sequences Incoming Sequences (EST/mRNA) • Make Quality (remove vector, polyA, NNNs) “Quality” sequences AssemblySequence Block with RepeatMasker Blocked sequences • Assign to DOTS consensus sequences (blastn at 40 bp length, 92% identity) • Cluster incoming sequences that are not covered by consensus sequence. DOTS Consensus Sequences “Unassembled” clusters • Assemble DOTS consensus sequences and incoming sequences with CAP4 - initially reassemble CAP4 assemblies (consensus sequences and new) • Calculate new DOTS consensus sequence using weighted consensus sequence(s) and new CAP4 assembly. New Consensus sequences Update GUS database