Download

1 / 22
220 likes | 247 Vues
This outline explores the development of tropical cyclone (TC) tracking in Australia, detailing changes in procedures, technology advancements, and critical historical milestones. It covers the evolution of best track procedures, database improvements, and current issues in TC analysis. The text provides insights into staffing arrangements, satellite data utilization, and the introduction of specialized tools like McIDAS. From the establishment of TC warning centers to the introduction of the modified Knaff-Zehr WPR, this comprehensive overview encapsulates the transformation of TC tracking practices over decades.

E N D
Outline • Current Practice • History – the Australian Region • Critical changes to TC tracking over decades • History – the Southern Hemisphere • Conclusions
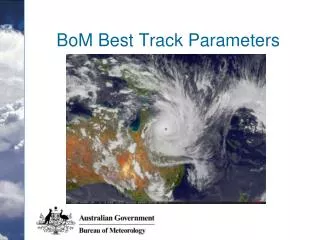
Current Practice • Mostly by Severe Weather Sections • Reanalysis from ‘scratch’ (usually!) • Modified Knaff-Zehr WPR used • Focus on TC threshold and peak intensity • Comprehensive set of parameters • Six-hourly (00, 06, 12, 18UTC) time fixes plus additional (3 to 1-hourly) near coast • Report produced in addition to BT data
Current Issues • Resource constraints: oceanic weak TCs get less than optimum BT approach • Varying analyst skill levels, eg. scatterometer interpretation • Assigning gale radii in asymmetric systems with temporal variations in structure • Consistency of application of definition of TC • Monsoon low vs extra-tropical vs hybrid … • Determining size parameters & environmental pressure
History • Best track procedures have changed over time due to • Changes in priority placed on TC analysis • Changes in staffing arrangements • Improved technology • Historical database limitations • Changing TC interpretations • Different WPRs used
Before 1908 • Knowledge limited to historical records of significant impacts on coastal communities.
1908-1950 • Bureau of Meteorology formed in 1908 • Cyclone tracks recorded – but only few detected; (good coverage of Queensland coast south of Cairns, very limited elsewhere) • Post-event reanalysis not practiced (but some basic reanalysis in a 1981 study) • More technology introduced to support WWII operations - acts as springboard to future developments
1950-1965 • Tropical Cyclone Warning Centres introduced in the mid 1950s (no specialist staffing). • More detailed recording of cyclone tracks (although many non cyclone events recorded)
1965-1978 • Evolution of polar satellite imagery • Raw analysis and observational data from cyclone events archived • Introduction of satellite intensity techniques 1969; 1973 Dvorak • TC Tracy (1974) focuses national attention on TCs
1978-1987 • Introduction of regular geostationary satellite data: April 1978 • Progressive changes in DVORAK analysis techniques • Introduction of CYCARD centralised database in 1983 (collation of disparate data sources)
1987-1995 • Implementation of dedicated severe weather sections • More focused study of Tropical Cyclones • Specialised skills at the best track analysis stage • Closer focus on Cold cored “Monsoon Lows” & extra-tropical transitions has lead to better analysis • Introduction of McIDAS • Better radar analysis & display tools • Large increase in numbers of Automatic Weather Stations (some offshore)
1995-2009 • Improvement in the understanding of some of the limitations of the original DVORAK techniques – particularly rapidly developing systems • Evolution of new satellite tools has assisted in the analysis of tropical cyclones esp. microwave and QScat (real-time and post-event) • Improved understanding of wind structure and intensity changes (global work) • Single WPR (modifeid Knaff-Zehr) introduced 2008/09
2009 • New database structure allows for more parameters to be stored • Old database was based on 132 character formatted text fields (based on old card technology) • New data to be stored on file includes • DVORAK data • Quadrant wind data (34, 48, 63 kn) • Comments field • Uncertainty fields
Critical changes over time • Mid-1950s: founding of TC warning centres, introduction of radar coverage • 1957: improved marine data collection through introduction of Port Meteorological Agents
Critical changes over time • Late 1960s/early 1970s: progressive improvement in satellite data availability • 1969: Satellite intensity technique (Oliver) • 1973-1983: Dvorak technique introduced • 1980-83: Dvorak used in close to its current form • 1978: change in definition for ‘hybrid’ systems – only small impact on total numbers but big local impact on high-latitude systems • 1984: maximum wind introduced in BT
Net impact of changes (relative to current DB) • Cyclone numbers: • slightly too high 1955-1978 (but problem largely addressed by work already done); • too low pre-1955, especially outside Queensland • Intensity: generally too weak pre-1985 and especially pre-1970
Database improvement • Review of best track archive commenced. • Phase one removal of obvious errors • Obvious typographical errors fixed • Duplications and omissions fixed • Obvious non-TC events removed • Phase two (2009/10) • Digitisation and checking of satellite data back to 1978 • Collation of other data • Phase three (2010/12) • Reanalysis of the geostationary satellite era ?????
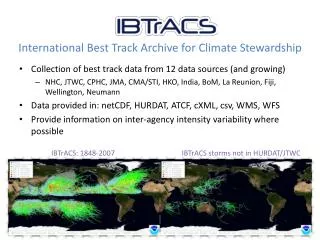
Conclusions • Consolidation of historical data from various regions is currently limited by the inhomogeneity of TC observation and analysis practice • There is evidently a considerable need for re-analysis of the historical TC data in order to obtain globally homogeneous records, something required to address the important question of how TC activity is changing and its possible relationship to global climate change more generally.
Acknowledgements Australian Government Department of Climate Change and NOAA’s National Climatic Data Center for financial support of the project “Climate change and the Southern Hemisphere tropical cyclones” Météo-France (La Réunion), the Meteorological Services of Fiji and New Zealand for providing regional TC data Philippe Caroff, Jim Davidson, Steve Ready, Alipate Waqaicelua and Howard Diamond for discussions on quality of regional TC data