
Advanced Earth Systems Coupling and Observing Networks for Performance and Forecasting
E N D
Presentation Transcript
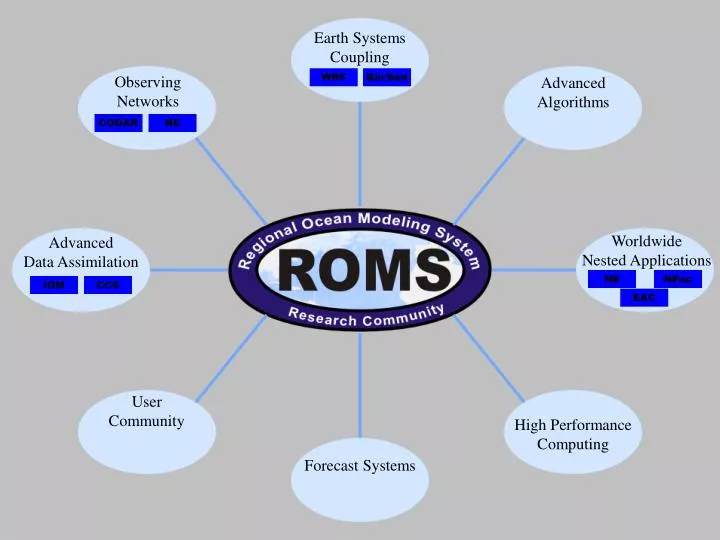
Earth Systems Coupling ObservingNetworks WRF Bio/Sed Advanced Algorithms CODAR NE Worldwide Nested Applications Advanced Data Assimilation NE NPac IOM CCS EAC User Community High Performance Computing Forecast Systems
Vertical spline interpolation Nbed Advanced Algorithms Fluid /sediment coupling Specialized split-explicit time-stepping
450 users from Academia ( ), Government ( ), and Companies ( ) http://marine.rutgers.edu/models/roms/index.php
North Pacific 1994-1999 (Curchitser)
Longterm Ecosystem Observatory New Jersey Shelf Observing System 30km x 30km 1998-2001 Satellites, Aircraft, Surface RADAR, Glider AUVs 300km x 300km Beginning 2001 LEO-15 LEO NJSOS THE STATE UNIVERSITY OF NEW JERSEY RUTGERS Station Field 3km x 3km 1996-Present
Cycle 2 Sea Breeze Mesoscale Event – July 17 00:00 GMT, 48 hour forecast 76 75 74 73 72 71 70 42 42 Seabreeze Front 41 41 40 40 39 39 38 38 1030 37 37 1025 Seabreeze Front NO Seabreeze 1020 36 36 1015 1010 1005 1000 EXP 48 hr forecast OP 48hr forecast NWS Radar 07/17 22Z
WRF and ROMS/TOMS Coupling Summer Supercell Test Updraft cells (yellow/white) drove strong convergent surface winds (white arrows) resulting in strong (2-3 m/s) surface currents. Surface height (color slice) variations of a half-meter over 20 km were observed, and waves propagate along the thermocline (shown in blue). (C. Moore)
EAC Global NCOM: Australia and New Zealand Sea Surface Height (cm) Nowcast: January 16, 2002 1/8 degree resolution
* Inverse Modeling in the California Current System a) * Deterministic fits of the physical (and biological) observations (inverse method strategy :allows the models to reach a dynamical consistent state, analysis of dynamical balances, eddies, transports …) Southern California Model Grid San Francisco * Data Assimilation (assimilation to combine different data sources: CTD’s, ADCP, Satellite and others … to aid general studies of the California Current System) Pt. Conception San Diego b) * [m] Predictability of physics and biology (dynamical theory :investigate the limits of predictability timescale and the dynamical basis for predictability) c) Ecosystem response to physical forcing (ecosystem model analysis : to what degree is the biology dependent on the physics? What level of compexity is needed in the ecosystem?) CalCOFI data array(50 years seasonal in situ obs.) d) Impacts of climate variability : El Niño (sensitivity model experiments : investigate the system response to changes of the mean state (eg. El Niños, Climate shifts …)