

Abstract
E N D
Presentation Transcript
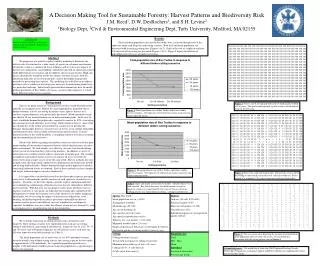
Results: Final and mean population sizes for the box turtles were consistent through each of the replicates under each longevity and cutting scenario. Both final and mean population size decreased with increasing cutting rates (Figures 1 & 2). Grids at the start of a replicate and after 100 intervals of harvesting are presented (Figures 3 & 4). Figure 5 depicts distribution of individuals after 100 years of timber harvesting. Conclusion Explicit viability modeling can be used to determine the likelihood of extinction in a dynamic habitat. A Decision Making Tool for Sustainable Forestry: Harvest Patterns and Biodiversity RiskJ.M. Reed1, D.W. DesRochers1, and S.H. Levine21Biology Dept, 2Civil & Environmental Engineering Dept, Tufts University, Medford, MA 02155 100 100 100 100 100 100 100 100 100 100 100 100 100 100 100 100 100 100 100 100 100 100 100 100 100 100 100 100 100 100 100 100 100 100 100 100 100 100 100 100 100 100 100 100 100 100 100 100 100 100 100 100 100 100 100 100 100 100 100 100 100 100 100 100 100 100 100 100 100 100 100 100 100 100 100 100 100 100 100 100 100 100 100 100 100 100 100 100 100 100 100 100 100 100 100 100 100 100 100 100 100 100 100 100 100 100 100 100 100 100 100 100 100 100 100 100 100 100 100 100 100 100 100 100 100 100 100 100 100 100 100 100 100 100 100 100 100 100 100 100 100 100 100 100 100 100 100 100 100 100 100 100 100 100 100 100 100 100 100 100 100 100 100 100 100 100 100 100 100 100 100 100 100 100 100 100 100 100 100 100 100 100 100 100 100 100 100 100 100 100 100 100 100 100 100 100 100 100 100 100 100 100 100 100 100 100 100 100 100 100 100 100 100 100 100 100 100 100 100 100 100 100 100 100 100 100 100 100 100 100 100 100 100 100 100 100 100 100 100 100 100 100 100 100 100 100 100 100 100 100 100 100 100 100 100 100 100 100 100 100 100 100 100 100 100 100 100 100 100 100 100 100 100 100 100 100 100 100 100 100 100 100 100 100 100 100 100 100 100 100 100 100 100 100 100 100 100 100 100 100 100 100 100 100 100 100 100 100 100 100 100 100 100 100 100 100 100 100 100 100 100 100 100 100 100 100 100 100 100 100 100 100 100 100 100 100 100 100 100 100 100 100 100 100 100 100 100 100 100 100 100 100 100 100 100 100 100 100 100 100 100 100 100 100 100 100 100 100 100 100 100 100 100 100 100 100 100 100 100 100 100 100 100 100 100 100 100 100 100 100 100 100 100 100 100 100 100 100 100 100 Abstract We propose to use spatially explicit viability modeling to determine the relative risks of extinction for a wide variety of species in a dynamic environment. Our model system is a commercial forest in Maine, and we will assess impacts of harvest rates and patterns, road building, and habitat regrowth on species persistence under different harvest scenarios and for different species characteristics. High-risk species identified by modeling will be the subjects of future research, both for identifying indicators of ecosystem integrity, and for developing management methods for preserving those species. This modeling also will allow us to address questions such as whether or not refuges are necessary for maintaining biodiversity in a particular landscape. Initial results presented here demonstrate how the model predicts persistence of Box Turtles (Terrapene carolina) when longevity is varied under different timber harvest scenarios. Background Species are going extinct at a much greater rate than would be predicted for naturally occurring processes. Habitat loss and fragmentation, frequently due to human economic activity, are among the major causes. Species that are area-sensitive or poor dispersers seem particularly threatened. Wood constitutes nearly one-third of all raw material humans use to make consumer goods. In the next 40 years, worldwide demand for pulpwood is expected to increase by 50%, even taking into account increased efficiency in recycling. North American forests, some of the most productive in the world, will contribute in a major way to meeting this demand. Increasingly, however, extractive uses of forests are in conflict with public environmental values such as biodiversity protection and recreation. In many forested sections of the world the public is struggling with how to balance economic and environmental goals for forests. Much of the debate regarding sustainable resource use derives from our poor understanding of how modern commercial forestry affects the persistence of native plants and animals. We lack reliable, cost-effective, accurate tools for identifying species at risk of extinction due to harvesting practices. In addition, a variety of harvest practices could be used to achieve a particular economic goal. For example, in temperate and northern forests, harvest can remove all trees, or selectively remove trees from a larger area to create the same yield. Harvest methods also vary in input, from allowing natural regeneration to planting fast-growing exotic hybrids and treating with herbicides. Market demand for high-quality paper has resulted in converting hardwood forests to softwood. Each of these methods can have complex and largely unknown impacts on native biodiversity. It is impossible to do detailed research on the thousands of species present in every forest to determine the specific reactions of each species to various harvest practices. Therefore, we have developed a spatially explicit simulation model for use in identifying combinations of life-history traits that are vulnerable to different harvest patterns. With this tool, one can propose and evaluate alternative harvest practices to protect at-risk species on industrial forest landscapes, and provide the information to evaluate the economic costs of the alternatives to timber companies. Specifically, we are assessing the impacts of harvest rates and patterns, road building, and habitat regrowth on species persistence under different harvest scenarios and for species with different survival, reproductive, and dispersal capacities. In addition, we can evaluate the efficacy of non-harvest alternatives, such as creating reserves, in ameliorating risk of local extinction. Figure 3: This is a 20 X 20 cell grid with cells of “high quality” habitat of 100 years. This grid would represent a patch of forest which had not been cut for 100 years. Figure 1: Final population sizes of Box Turtles under three timber harvest scenarios. 100 replicates of 100 intervals (years) each were run. Points represent means. 120 15 15 120 120 10 9 120 120 4 4 120 120 26 26 120 120 20 20 120 120 15 15 120 120 10 10 120 120 4 4 120 120 26 26 120 120 21 20 120 120 16 15 120 120 10 10 120 120 5 4 120 120 26 26 120 120 21 21 120 120 16 16 120 120 10 10 120 120 5 5 120 120 27 26 120 120 21 21 120 120 16 16 120 120 11 10 120 120 5 5 120 120 0 27 120 120 21 21 120 120 16 16 120 120 11 11 120 120 5 5 120 120 0 0 120 120 22 21 120 120 17 16 120 120 11 11 120 120 6 5 120 120 0 0 120 120 22 22 120 120 17 17 120 120 11 11 120 120 6 6 120 120 0 0 120 120 22 22 120 120 17 17 120 120 12 11 120 120 6 6 120 120 1 0 120 120 22 22 120 18 17 17 12 12 12 12 7 7 6 6 1 1 1 1 23 23 23 22 120 18 17 15 12 12 12 9 7 7 6 4 1 1 1 26 23 23 23 20 120 120 15 15 120 120 9 9 120 120 4 4 120 120 25 25 120 120 20 20 120 120 14 14 120 120 9 9 120 120 3 3 120 120 25 25 120 120 20 20 120 120 14 14 120 120 9 9 120 120 3 3 120 120 25 25 120 120 19 19 120 120 14 14 120 120 8 8 120 120 3 3 120 120 25 25 120 120 19 19 120 120 14 14 120 120 8 8 120 120 3 3 120 120 24 24 120 120 19 19 120 120 13 13 120 120 8 8 120 120 2 2 120 120 24 24 120 120 19 19 120 120 13 13 120 120 8 8 120 120 2 2 120 120 24 24 120 120 18 18 120 120 13 13 120 120 7 7 120 120 2 2 120 120 24 24 120 120 18 18 120 120 13 13 120 120 7 7 120 120 2 2 120 120 23 23 120 120 18 18 120 Figure 2: Mean population sizes of Box Turtles under three timber harvest scenarios. 100 replicates of 100 intervals (years) each were run. Points represent means. Figure 4: This is the same forest patch after 100 intervals (years) where harvesting occurred each year at the rate 8 cells harvested/year. Forest growth was stopped at 120 years to represent consistent high quality. Table 1: Input and output (green) data for model. All habitat data were held constant. Box Turtle data were also held constant except for longevity which was varied from 25-100 years at 25 years intervals. Cutting activity was varied from no cutting – cutting 8 cells/interval 11 0 0 5 6 0 0 13 9 0 0 10 8 0 2 11 10 0 0 12 9 0 0 9 10 0 0 10 10 0 0 5 11 1 1 10 11 0 0 4 6 0 0 10 7 0 0 11 7 0 0 6 8 0 1 7 6 0 0 11 8 0 0 9 10 0 0 9 10 0 0 11 5 2 2 7 6 0 0 8 9 0 0 8 8 0 0 10 4 0 0 5 7 0 1 11 9 0 0 12 8 0 0 6 6 0 0 9 8 0 0 8 8 0 0 8 10 0 0 9 7 0 0 5 7 0 0 9 9 0 0 9 9 0 0 12 9 0 0 11 10 0 0 6 7 0 0 10 9 0 0 4 11 0 0 8 10 0 0 7 8 0 0 10 11 0 0 10 9 0 0 8 6 0 0 11 9 0 0 7 0 0 0 0 0 0 0 0 0 0 0 0 0 0 0 0 0 0 0 10 1 0 0 0 0 0 0 0 0 0 0 0 0 0 0 0 0 0 0 12 11 0 0 8 12 0 0 7 11 0 0 9 2 1 0 8 11 0 0 8 8 0 0 7 9 0 0 4 11 0 0 9 7 0 0 10 11 0 0 5 7 0 0 12 9 0 0 8 10 0 0 9 10 1 0 9 10 0 0 5 10 0 0 11 9 0 0 10 10 0 0 9 10 1 0 5 9 0 0 11 11 0 0 9 12 0 0 8 9 0 0 10 6 0 0 11 9 0 0 10 8 0 0 8 8 0 0 9 10 0 0 8 6 0 0 8 7 0 0 7 9 0 0 11 10 0 0 10 9 0 0 9 9 1 0 7 9 0 0 9 8 0 0 9 9 0 0 11 10 0 0 9 5 0 0 9 10 0 0 10 10 0 0 4 7 0 0 9 10 0 0 9 9 0 0 9 7 0 0 9 Methods We tested the interaction of cutting intensity with varying box turtle longevity. Three cutting scenarios were implemented for each age: no cutting, cutting 4 cells/interval, and cutting 8 cells/interval. Longevity was set at 25, 50, 75, and 100 years, and 100 hundred replicates of 100 intervals (years) each were run. All other input data were held constant (see Table 1). The initial population size of turtles was set at 1,850 individuals because when the model is run without cutting activity, the carrying capacity for box turtles is approximately 3,700 individuals. In a sigmoidal population growth curve, roughly 1,850 individuals would be present when the population is experiencing its fastest rate of growth. Figure 5: This is a census array depicting the location of all individuals in the population after 100 intervals (years). The distribution is concordant with the cutting pattern seen in Figure 4. Acknowledgements: We would like to thank the AT&T Industrial Ecology Faculty Fellowships Program for its financial support and Rebecca Harris for compiling life history data for the Box Turtle.


