Download
1 / 61
630 likes | 793 Vues
Chapter 15 – The Personal Income Tax. Public Economics. Basic Structure. Figure 15.1 shows the series of steps used to compute a person’s tax liability. Step 1: Compute Adjusted Gross Income (AGI) Step 2: Convert AGI into taxable income by subtracting exemptions and deductions

E N D
Chapter 15 – The Personal Income Tax Public Economics
Basic Structure • Figure 15.1 shows the series of steps used to compute a person’s tax liability. • Step 1: Compute Adjusted Gross Income (AGI) • Step 2: Convert AGI into taxable income by subtracting exemptions and deductions • Step 3: Compute tax due by applying a rate schedule, and subtracting tax credits.
Basic Structure • Later in this lesson, will discuss extensively the “real-life” aspects of the U.S. tax code. • Before doing that, useful to think about what the tax code “should” look like.
Defining Income • Which forms of income could be taxed? • Wages and salaries, rents, dividends, and so on … • Haig-Simons definition of income: Income is the money value of the net increase in an individual’s power to consumer during a period.
Defining Income • H-S criterion: • Includes net additions to wealth • All sources of potential increases in consumption (regardless of whether consumption took place) • Subtracts losses
Defining Income:Items included in H-S Income • H-S definition encompasses: • Items ordinarily thought of as income include wages, salaries, business profits, rents, royalties, dividends, and interest • Employer pension contributions and insurance premiums • Transfer payments like Social Security, Unemployment Insurances, and Welfare • Capital Gains (whether they are realized or unrealized) • Imputed rental income from durable goods
Defining Income:Problems • Business expenses are often difficult to parse out into “consumption” and “costs of obtaining income” • Unrealized capital gains and losses difficult to measure • Imputed rental income from durables difficult to impute • In-kind services (such as housework) difficult to value
Defining Income:Evaluating the H-S Criterion • Clearly, arbitrary decisions need to be made on how to define income from a practical point of view. • H-S criterion appeal to: • Horizontal equity – people with equal incomes should pay equal taxes • Neutrality – it treats all forms of income the same, and does not distort economic activity.
Excludable Forms of Income:Interest on State and Local Bonds • Interest earned on bond issued by state or locality is untaxed (while interest earned on the bond of a private company is taxed). • Investors are therefore willing to accept a lower before-tax rate of return on these bonds.
Excludable Forms of Income:Interest on State and Local Bonds • For example, if the return in the private market is r, then investors will purchase state bonds as long as the return is higher than (1-t)r, where t is the marginal tax rate on investment income.
Excludable Forms of Income:Interest on State and Local Bonds • The state save money (by paying less interest) while the federal government loses (by collecting less tax revenue). • It is not usually the case that the state’s gains exactly offset the federal government’s losses – it will usually be the case that the federal government’s loss is greater.
Excludable Forms of Income:Interest on State and Local Bonds • Illustration • Suppose the private market return is r=20% • Progressive tax system • Low income – t=0% • Moderate income – t=15% • High income – t=28%
Excludable Forms of Income:Interest on State and Local Bonds • Illustration • With this information, the return necessary to induce a person to invest in the state bond is: • (1-tLOW)r = 20% for low income group • (1-tMOD)r = 17% for moderate income group • (1-tHIGH)r = 14.4% for high income group • Thus, people in higher tax brackets are more likely to benefit from buying state bonds.
Excludable Forms of Income:Interest on State and Local Bonds • Illustration • Assume each group has some amount of capital that can be invested in either a private bond or state bond (each with equal riskiness). • Low income: $100,000 to invest • Moderate income: $75,000 to invest • High income: $250,000 to invest
Excludable Forms of Income:Interest on State and Local Bonds • Illustration: Equal gains and losses • If the state government needs to raise $100,000, what rate of return should it offer? • It should offer a return r=14.4%, because it can induce the high income people to supply enough capital. • How much does the state government save? • Instead of paying r=20% on $100,000, it instead pays r=14.4%, saving 5.6%x$100,000 or $5,600. • How much does the federal government lose? • The federal government would have collected taxes on interest of $20,000 (20%x$100,000). It therefore loses 28%x$20,000=$5,600.
Excludable Forms of Income:Interest on State and Local Bonds • Illustration: Unequal gains and losses • If the state government needs to raise $325,000, what rate of return should it offer? • It should raise the return to r=17%, because it must also induce the moderate income group to provide capital. • The high income group (which provides $250,000 of capital) receives some economic rents because it would have provided the capital for r=14.4%.
Excludable Forms of Income:Interest on State and Local Bonds • Illustration: Unequal gains and losses • How much does the state government save? • Instead of paying r=20% on $100,000, it instead pays r=17%, saving 3%x$325,000 or $9,750. • How much does the federal government lose? • From the high income group, the federal government would have collected taxes on interest of $50,000 (20%x$250,000). It therefore loses 28%x$50,000=$14,000. • From the moderate income group, the federal government would have collected taxes on interest of $15,000 (20%x$75,000). It therefore loses 15%x$15,000=$2,250.
Excludable Forms of Income:Interest on State and Local Bonds • Illustration: Unequal gains and losses • The state government saves $9,750 in interest payments • The federal government loses $16,250 in tax collections • The net effect of tax exempt bonds is zero only for those investors who are just on the margin of choosing tax-exempt versus taxable securities.
Excludable Forms of Income:Some Dividends • In 2003, legislation was passed which lowered the maximal tax rate on dividends to 15%. • Previously, it was taxed as ordinary income.
Excludable Forms of Income:Capital Gains • The maximum capital gains tax rate (in 2004) is 15%, while the maximum federal tax rate on ordinary income is 38.6%. • Capital gains held for less than 12 months are taxed as ordinary income. • Capital losses offset capital gains, and can be subtracted from ordinary income (up to a cap of $3,000).
Excludable Forms of Income:Capital Gains • One interesting aspect of the treatment of capital gains is that only realized capital gains are taxed. • As the illustration below dramatically shows, the timing of realizations can matter greatly for total portfolio wealth, even holding the composition of assets fixed.
Excludable Forms of Income:Capital Gains • Example: • Asset with principal of $100,000 • r=12% • Time horizon is 20 years • Tax rate = 15%
Excludable Forms of Income:Capital Gains • Capital gains not realized until end of 20 years: • Value of investment is $100,000x(1+.12)20 = $964,629. • Capital gain is $964,629-$100,000 = $864,629 • Tax owed is 15%x$864,629 = $129,694 • Wealth = $964,629-$129,694 = $834,935
Excludable Forms of Income:Capital Gains • Capital gains realized each year • After tax rate of return is not 12%, but rather (1-.15)x12% = 10.2% since taxes are paid along the way rather than at the end • Value of investment is $100,000x(1+.102)20 =$697,641. • Wealth = $697,641
Excludable Forms of Income:Capital Gains • Wealth is more than $137,000 lower by realizing capital gains along the way rather than deferring tax payments until the end. • Deferral allows the money to grow geometrically at the before-tax rate of return. • “Taxes deferred are taxes saved”
Excludable Forms of Income:Capital Gains • Investors who are considering switching or selling assets must therefore take into account the fact that a tax liability will be created. • Investors may be less likely to change their portfolios, known as the lock-in effect. • May lead to misallocation of capital.
Excludable Forms of Income:Capital Gains • Capital gains are not taxed at death • Basis is raised to current level • If person sold $1200 portfolio (with $200 of capital gains) immediately before death, the gain is subject to taxes. • If the person bequeathed the $1200 portfolio to his heirs, who then sold it immediately, there is no “gain” and thus no taxes.
Excludable Forms of Income:Employer Contributions • If an employer pays premiums for a health insurance plan, those contributions are not taxed. • If the employer instead paid the employee in the form of higher wages, the wages would be taxed.
Excludable Forms of Income:Some types of Saving • There are numerous tax-deferred or tax-free savings vehicles. • Although they have different names, they usually share a number of characteristics. • In all of these plans, the investment accrues at the before tax rate of return, and do not suffer from the lock-in effect.
Excludable Forms of Income:Some types of Saving • IRAs (Individual Retirement Accounts) • Roth IRAs • 401(k) (also 403(b) for not-profit, 457(b) for government) • Self-employment Retirement Plans • Education Savings Account
Excludable Forms of Income:Some types of Saving • Do the existence of various tax-favored saving options stimulate saving? • Not clear whether aggregate saving is affected, or whether people merely shuffle around their portfolios. • Very contentious issue, but most research favors the view that at least some of the saving is new saving.
Exemptions and Deductions • One AGI is determined, subtract certain exemptions and deductions to arrive at taxable income.
Exemptions • Exemptions • Family allowed an exemption for each member • Exemption in 2003 was $3,050 per family member, so a husband and wife with three dependent children could claim five exemptions and subtract $15,250 from AGI. • Exemptions phased out for households with high AGI’s.
Exemptions • Exemptions • Why have exemptions? • Adjust ability to pay in the presence of children • Relative to deductions, not much room for affecting the exemptions claimed.
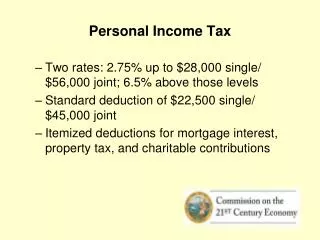
Deductions • The other subtraction from AGI is a deduction. There are two types: • Standard deduction – a fixed amount that requires no documentation • Itemized deduction – subtractions for specific items cited in the law, must list each item separately, and be able to prove the expenditures were made • Taxpayers would choose whichever one minimized their tax liabilities.
Deductions • Standard deduction in 2003 was $4,750 for single individuals, and $7,950 for joint filers. • Around 67% of tax returns take the standard deduction.
Deductions • As long as a household is itemizing, deductibility changes relative prices. • If the price of Z is PZ and the household’s marginal tax rate is t, then the “effective price” is lowered from PZ to (1-t)PZ. • This would likely affect the quantity demanded • The higher the tax rate, the lower the effective price
Deductions:Some Specific Items • Unreimbursed medical expenses that exceed 7.5% of AGI • Only medical expenses above the threshold are deductible • Creates incentives to “stack” medical procedures in one calendar year, and potentially time these procedures for years when AGI is low
Deductions:Some Specific Items • State and local income and property taxes • In 2000, these deductions amounted to $290 billion. • Sales taxes are not deductible. • For those who itemize, lowers the effective costs of paying these taxes.
Deductions:Some Specific Items • Certain interest expenses • Interest on home mortgages • Conventional mortgages • Home equity loans • Lowers the effective price of home ownership • Student loans • Not interest paid on consumer debt like credit cards
Deductions:Some Specific Items • Charitable contributions • Charitable deductions cannot exceed 50% of AGI • In 2000, $134 billion in deductions for charitable contributions • Tax deductibility lowers the effective “price” of giving. Elasticity estimates around 0.5, which mean that lowering the effective price from $1 to $0.7 increases giving by 15%.
Credits • A tax credit is a subtraction from tax liability (not taxable income). • Unlike deductions, the value of the credit is independent of the tax rate. • Number of credits in the tax system, including the “kiddie tax credit” which is $1000 per child, and credits for college expenses.
Tax expenditures • Tax expenditures are the revenues forgone due to preferential tax treatment. • The revenue loss for 2004 will exceed $600 billion.
Rate Structure • The taxable income scale is divided into segments, and the law specifies the marginal tax rate that applies to income from each segment. • Four different schedules • Single • Married, filing jointly • Married, filing separately • Heads of household
Rate Structure • In 1913, bracket rates ranged between 1-7% • In 1945, rates ranges between 23-94% • In mid-1980s, rates ranges between 11-50%, with 14 brackets • 1986: Two brackets, 15% and 28% • Rates crept up in 1990s • Trend was reversed in 2001
Rate Structure • Table 15.1 shows the official statutory tax rate schedule for 2003. • Rates vary between 10% and 38.6%.
Rate Structure • Official statutory marginal tax rates may not correspond well to actual marginal tax rates because of various deductions and credits. • Figure 15.2 illustrates actual marginal tax rates for a family of 4 that takes advantage of various education credits.