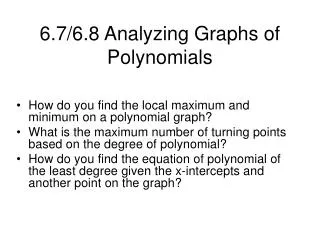
Analyzing Polynomial & Rational Functions & Their Graphs
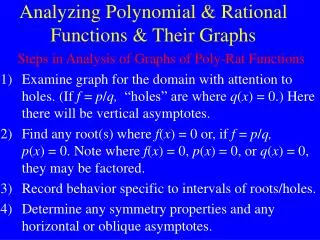
Analyzing Polynomial & Rational Functions & Their Graphs. Steps in Analysis of Graphs of Poly-Rat Functions Examine graph for the domain with attention to holes. (If f = p / q, “holes” are where q ( x ) = 0.) Here there will be vertical asymptotes.

Analyzing Polynomial & Rational Functions & Their Graphs
E N D
Presentation Transcript
Analyzing Polynomial & Rational Functions & Their Graphs Steps in Analysis of Graphs of Poly-Rat Functions Examine graph for the domain with attention to holes. (If f = p/q, “holes” are where q(x) = 0.) Here there will be vertical asymptotes. Find any root(s) where f(x) = 0 or, if f = p/q, p(x) = 0. Note where f(x) = 0, p(x) = 0, or q(x) = 0, they may be factored. Record behavior specific to intervals of roots/holes. Determine any symmetry properties and any horizontal or oblique asymptotes.
Polynomial & Rational Inequalities Steps to Solution & Graph of Poly-Rat (In)equalities Write as form: f(x) > 0, f(x) > 0, f(x) < 0, f(x) < 0, or f(x) = 0, with single quotient if f is rational. Find any root(s) of f(x) = 0 &, if f = p/q, find “holes” where q(x) = 0. Factor f , p, q as possible. Separate real number line into intervals per above. For an x = xi in each interval find f(xi). Note: sign[f(xi)] = sign[f(x)] for xi in interval i. Use this to sketch graph. Also, if f inequality was > or < , include in solution set roots of f from 2) above.
Poly-Rat Inequalities Example Step 1: (x + 3) – (x + 3)(x – 1)> 0. (x– 1)2 (x – 1)(x – 1) Solve & graph: (x + 3) > (x + 3) . (x2 - 2x + 1) (x – 1) (x + 3)(2 – x) > 0 ___ (x – 1)2 or f(x) = p(x)/q(x) > 0 with p(x) = (x + 3)(2 – x) and q(x) = (x – 1)2.
Poly-Rat Inequalities Example cont’d Step 2: Note roots of f(x) = roots of p(x). They are at x = –3 and at x = 2. The point x = 1 is a zero of q(x) so there f(x) is undefined and x = 1 is a “hole” or not in the domain. Solve & graph: (x + 3)(2 – x) > 0 ___ (x – 1)2 Step 3: The intervals: (-, -3]; [-3, 1); (1, 2]; [2, ). f(x) values: f(-4)= -6/25, f(0)= 6, f(3/2)= 9, f(3)= -3/2 ,
Poly-Rat Inequalities Example cont’d Step 2 & 3 Data Summery: x-intercepts: atx = –3 and atx = 2. y-intercept: aty = f(0) = 6. f(-x) = (-x + 3)(2 + x) f(-x) _ _ (-x – 1)2 No symmetry. Solve & graph: (x + 3)(2 – x) > 0 ___ (x – 1)2
Poly-Rat Inequalities Example cont’d Step 2 & 3 Data Summery cont’d: Vertical asymptote: at x = 1. Hole:x= 1 Horizontal asymptote: aty= -1 Intervals: - < x < -3, -3 < x < 1, 1 < x < 2, 2 < x < . Solve & graph: (x + 3)(2 – x) > 0 ___ (x – 1)2
Poly-Rat Inequalities Example cont’d f(x) = (x + 3)(2 – x)/(x – 1)2. Test evaluations of f(x) to get sign in intervals 3 -4 0 3/2 f(3)= -3/2 f(-4)= -6/25 f(0) = 6 f(3/2) = 9 Above x -axis Above x -axis Below x-axis Below x-axis (-4, -6/25) (0, 6) (3/2, 9) (3, -3/2)
[ )( ] [ )( ] -3 -2 -1 0 1 2 -3 -2 -1 0 1 2 Poly-Rat Inequalities Example cont’d Step 4 Graphs: A) Solution set as intervals on the number line – (-, -3]; [-3, 1); (1, 2]; [2, ). neg 0 pos pos 0 neg Solve & graph: (x + 3)(2 – x) > 0 ___ (x – 1)2
Poly-Rat Inequalities Example cont’d Step 4 Graphs: B) Solution set in graph sketch of f(x) versus x. First plot known points. Then sketch. Do not forget in sketching to include information about asymptotes. In this case, since x = 1 is a zero of multiplicity 2 in q(x), there is a vertical asymptote at x = 1. Also, since both p(x) and q(x) are of 2nd degree, there is a horizontal asymptote at y = – 1/1 as |x| increases. Solve & graph: (x + 3)(2 – x) > 0 ___ (x – 1)2
9- 6- 3- -5 -4 -3 -2 -1 0 1 2 3 4 5 Test values: (-4, -6/25), (3/2, 9), (3, -3/2) Sketch of f(x) graph Hole & Asymptotes: (1, 0), x = 1, y = -2 Intercepts: (-3, 0), (0, 6), (2, 0) Sketch of f(x) > 0 graph in red Poly-Rat Inequalities Example cont’d Solve & graph: (x + 3)(2 – x) > 0 ___ (x – 1)2