Array Platforms
This study investigates the effects of various ligands on gene expression patterns in B-cell samples using Agilent's 16K inkjet-printed cDNA microarrays. The arrays feature a comprehensive collection of cDNAs from the RIKEN FANTOM project and include over 13,000 mouse genes. B-cell samples were cultured with and without ligands over various time periods for total RNA isolation. Differential expression was analyzed using hierarchical clustering, Z-score, and significance analysis of microarrays (SAM) to identify upregulated and downregulated genes across conditions.

Array Platforms
E N D
Presentation Transcript
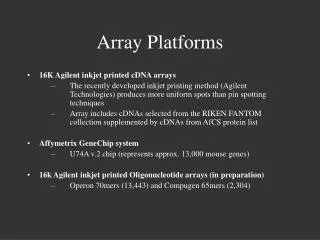
Array Platforms • 16K Agilent inkjet printed cDNA arrays • The recently developed inkjet printing method (Agilent Technologies) produces more uniform spots than pin spotting techniques • Array includes cDNAs selected from the RIKEN FANTOM collection supplemented by cDNAs from AfCS protein list • Affymetrix GeneChip system • U74A v.2 chip (represents approx. 13,000 mouse genes) • 16k Agilent inkjet printed Oligonucleotide arrays (in preparation) • Operon 70mers (13,443) and Compugen 65mers (2,304)
Ligand Screen Transcript Analysis • B cell samples prepared by Cell Lab. • Cultured for different time periods (.5, 1, 2, and 4 hr) in the presence or absence of ligands before harvesting for total RNA isolation. • Treated and untreated time-course samples hybridized against a spleen reference. • After removing the common spleen denominator, comparison to 0 time point data reflects the changes in mRNA levels due to ligand treatment and/or time in culture. • All of the experiments were done in triplicate. Including in controls >450 arrays
Molecular Biology Laboratory Microarray & Analysis Sangdun Choi Xiaocui Zhu Rebecca Hart Anna Cao Mi Sook Chang Jong Woo Kim Sun Young Lee
Clustering Analysis of Gene Expression Profile Using log2Ratio (Treated/0hr) a. Calculate gene expression value: Compute log2(Treated/0hr) = log2(Treated/Spleen) – log2(0hr/Spleen) using processedSignalIntensity b. Hierarchical cluster: with genes showing >= 2 fold change in at least one condition while keeping ligands in alphabetical/time course order: Average of 6-23 replicates Average of triplicates 30min 1hr 2hr 4hr 30min 2MA 1hr 2MA 2hr 2MA 4hr 2MA 30min AIG 1hr AIG 2hr AIG 4hr AIG …. 132 conditions Gene 1 Gene 2 Gene 3 …….. 5281 genes
Ligands, time course ( i.e. medium- 30 min, 1hr, 2hr, 4hr; 2MA- 30 min, 1hr, 2hr, 4hr…) Genes, clustered
Genes up regulated in AIG, CD40L, IL4, LPS and CpG CD40L None LPS AIG CpG IL4 Hk2 Ak2 Ccnd2 Cdk4 Bax Ifrd2 cdk6 Atf Caspase 4 317 features Image contrast: 1.07
Genes down regulated in AIG, CD40L, IL4, LPS and CpG CD40L None LPS AIG CpG IL4 cAMP-GEFII Gprk6 Bcap31 Gnai2 id3 Bnip3l 319 features Image contrast: 1.07
Genes showing AIG & CD40L specific changes CD40L None CpG LPS AIG IL4 Gadd45b Par-6 Dagk1 IL3ra IL10ra Mapk12 235 features Image contrast: 1.16
Genes up regulated in IL4 CD40L None CpG AIG LPS IL4 Socs1 Caspase 6 Xbp1 Dapp1 Rgs14 42 features Image contrast: 1.14
Genes showing AIG specific changes None CD40L AIG CpG LPS IL4 Stress induced protein Bak1 Bcl2l11 LTb apolipoprotein E 65 features Image contrast: 1.54
Madhusudan Natarajan Rama Ranganathan
Clustering Analysis of Gene Expression Profile Using Z Score Z score: a measurement of the distance between an observed value and the mean of a population Observed value basal
Clustering Analysis of Gene Expression Profile Using Z Score • a. Calculate gene expression metric, x: • For each gene i on a given chip j: xij ={rMedianIntensity (treated) / gMedianIntensity (spleen) }/ xj , where xj is the mean of intensity ratio of all genes on chip j • Calculate the mean and standard deviation of gene expression in 27 sets of 0hr untreated data: • For each gene i, calculate the mean(mi) and the standard deviation (i) of expression on • 27 0hr chips; • Calculate Z score as a measurement of differential expression from 0hr condition • For each gene i on a given chip j, Zij = (xij – mi) / i • Cluster genes and ligands using Z-score: • with genes whose Z > 2 in any of the ligands
AfCS Data Analysis- Microarray Dennis Mock UC Principal Statistician University of California, San Diego Director: Shankar Subramaniam Acknowledgment: Eugene Ke, Bob Sinkovits, Brian Saunders
Two-way hierarchical clustering –unsupervised- Ligands (n=33) (0hr, .5h, 1h, 2h, 4h) Note: the ligand cluster according early –late conditions with 90-100% accuracy (metrics: sample = Euclidean; gene = Pearson) mitogenic Interleukins early .5-1 hr (non-mitogenic) late 2-4 hr 0 hr late 2-4 hr early .5-1 hr . . . . . . . . . Dennis Mock - UCSD
Significance analysis of microarrays* (SAM)(R. Tibshirani, G. Chu 2002) For each gene, define the adjusted “t-statistic” as follows: Objective: The replicated expression for each gene is taken for the 4hr time condition (untreated vs ligand) to determine whether the gene is statistically differentially up- or down- regulated. treated - untreated • mean of replicates standard deviation for the gene + adjustment factor The t-statistics for all the genes are ordered and noted. The labels are then permutated and the t-statistic is calculated again. After many iterations, the cumulative t-statistics is averaged for each gene. Finally, for a given false positive rate, [called “False Discovery Rate” or FDR], the significant genes are selected. Dennis Mock - UCSD
Concordance of significantly up (+) or down (-) regulated genes mitogenic ligands (FDR = 1%) “down-regulated” matches Mosaic plot 135 (-) 3 (-) 147 (-) 337 (-) 553 (-) 96 (-) 756 (-) 1082 (+) 3 (-) Example: CD40L had 756 down-regulated and 1082 up-regulated genes. Those which were similarly regulated in AIG: 337 down 578 up. 119 (-) 341 (-) 2 (-) 72 (-) 446 (-) 887 (+) 143 (-) 151 (-) 3 (-) 152(-) 80(+) “up-regulated” matches 1 (-) 578 (+) 796 (-) 854 (+) 72 (+) 73 (+) 47 (+) 171 (-) 163 (+) Discordance matrix 597 (+) 477 (+) 18 (+) 3 (-) 10 (+) 117 (+) 117 (+) 108 (+) 4 (+) 6 (+) 3 (+) 5 (+) 4 (+)
Beyond Clustering • How can we obtain biological information from array data at the level of individual genes and correlations in expression between genes? • Can we use the correlations to build a connection network that reflects correlations in expression? Is there biological significance to this?
Two-way hierarchical cluster: mean ratio (vs control) of phosphoprotein levels and ligand Note: the ligands that elicit an ERK response (chemokines + AIG, CD40L) clustered together.
Transcription factor encoded by fos is stabilized by ERK and continues to affect other IE genes such as jun from Nature Cell Biology august 2002 v 4 issue 8
A clear lesson that we must implement as soon as possible is to decrease the cycle time from experimental design - data collection - data analysis - conclusions, models - to experimental redesign. In the past the rate limiting step has been data analysis
Input Signals Signal Processing Translocation Cytoskeleton Gene Expression Transcription Translation Transcription Translation