Download

1 / 7
0 likes | 1 Vues
Matching SKU data normalization standardizes product names, volumes, and packaging across retailers, enabling accurate comparisons and actionable insights.<br>

E N D
Matching SKU Data Normalization for Accurate Product Comparison Across Retailers The client, a global retail analytics company, faced significant challenges in managing SKU-level data across multiple grocery and liquor platforms. Product information was inconsistent, with the same items listed differently across stores and formats, such as 750ml versus 0.75L. These discrepancies made accurate price comparison, inventory tracking, and reporting extremely difficult. Implementing Matching SKU data normalization allowed the client to reconcile different product representations into a single, standardized format. This ensured consistency across multiple datasets and improved reliability in analytics and forecasting. By matching disparate SKU names like 750ml vs 0.75L, the client could accurately compare prices, track inventory, and monitor trends across regions and platforms without confusion caused by inconsistent naming conventions. Additionally, the ability to normalize volume and size attributes across SKUs data helped consolidate product information, enabling seamless integration with dashboards, reporting tools, and analytics pipelines. This process empowered the client to generate reliable insights, optimize inventory, and improve decision-making efficiency.
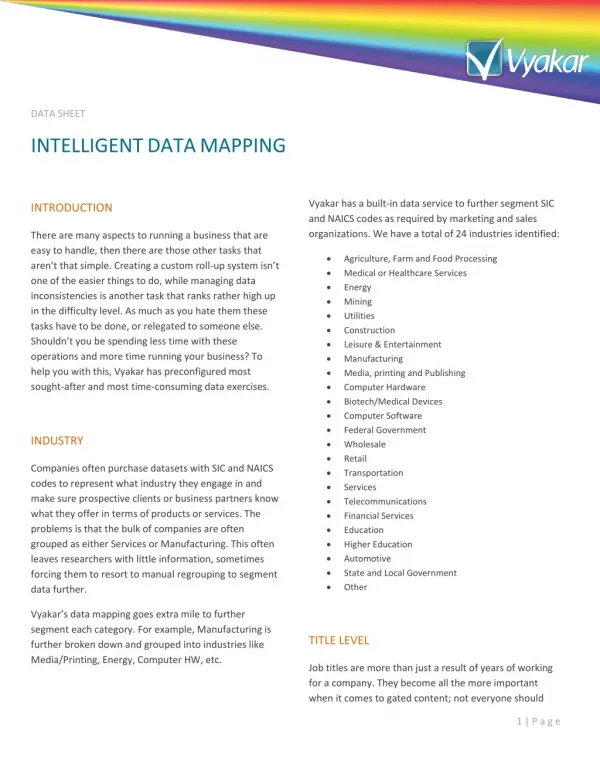
The Client A Well-known Market Player in the Liquor Industry iWeb Data Scraping Offerings: Leverage our data crawling services scrape liquor data. Client’s Challenges The client faced major difficulties in managing and analyzing product-level data across multiple retailers due to inconsistent SKU naming conventions, volume descriptions, and packaging formats. These inconsistencies made it challenging to compare pricing, inventory, and promotions accurately across stores. Tracking inventory and pricing across multiple locations was further complicated by the sheer volume of products and frequent updates, leading to gaps in insights and delayed decision-making. Without a standardized framework, SKU-level comparisons were unreliable, limiting forecasting and competitive analysis. The client struggled with SKU matching across retailers, as the same product could appear differently across platforms, causing duplication and misalignment in datasets. Performing a match SKUs across ABC Fine Wine, Spec’s Spirits manually was inefficient, time-consuming, and error-prone. Additionally, the lack of automated text similarity scraping for SKU matching hindered their ability to reconcile disparate product representations, impacting pricing strategy and inventory optimization across multiple retail chains.
Our Solutions: Liquor Data Scraping To resolve the client’s challenges, we implemented automated systems for SKU normalization, price tracking, and inventory monitoring across multiple liquor retailers. By standardizing product names, volumes, and packaging formats, we ensured consistent and accurate comparisons across stores. Using Liquor unit of measure normalization in retail data, the client could reconcile items like 750ml and 0.75L into a single, comparable SKU, eliminating duplication and improving reporting accuracy. Leveraging Liquor Data Extraction Services, we collected SKU-level pricing, stock, and promotional data from ABC Fine Wine, Spec’s Spirits, and Top Ten Liquors in real time. Our Liquor Data Scraping API Services provided seamless integration with dashboards and analytics tools, enabling ongoing monitoring and rapid insights for inventory planning, pricing strategy, and competitive benchmarking.
Sample SKU Normalization & Pricing Dataset Web Scraping Advantages Faster Market Insights: Our services provide real-time, structured information, enabling businesses to quickly identify pricing trends, stock changes, and promotional activity. This accelerates decision-making, improves responsiveness, and strengthens competitive advantage in dynamic retail environments. Reduced Manual Effort: Automation eliminates time-consuming manual tracking of products, prices, and inventory across multiple platforms. Teams can focus on strategy, analysis, and planning instead of repetitive tasks, improving operational efficiency and overall productivity. Improved Accuracy and Consistency: Structured data collection and validation reduce errors, inconsistencies, and duplication. Businesses gain reliable, high-quality datasets that support reporting, analytics, and forecasting with confidence. Scalable Across Markets: Our solutions scale effortlessly to cover more SKUs, cities, or retail platforms. This allows businesses to expand monitoring without compromising speed, data quality, or operational efficiency. Actionable Insights for Growth: Organized and clean data empowers businesses to identify opportunities, optimize pricing and inventory, benchmark performance, and make informed strategic decisions that drive measurable growth.
Final Outcome The implementation of our solutions enabled the client to gain complete visibility into liquor pricing, inventory levels, and regional trends across multiple retail chains. Automated data collection replaced manual tracking, ensuring consistent, accurate, and real-time insights into SKU-level pricing and stock fluctuations. Access to structured Liquor and Alcohol Price Datasets allowed the client to benchmark prices, monitor promotions, and identify market trends effectively, improving pricing strategies and competitive intelligence. Furthermore, Alcohol and liquor Store location Data Scraping enabled monitoring of store-specific availability and regional variations, providing actionable insights for inventory planning and distribution optimization. As a result, the client enhanced operational efficiency, improved forecasting accuracy, and strengthened decision-making capabilities, empowering their team to respond quickly to market changes and maintain a strong position in the competitive liquor retail landscape. Client’s Testimonial "Partnering with this data scraping team has transformed how we monitor liquor pricing and inventory across multiple retail chains. Their automated solutions replaced manual tracking, delivering accurate, real-time insights consistently. The normalized SKU datasets allowed our team to compare products across stores, monitor trends, and make faster, data-driven decisions. Their attention to detail, responsiveness, and scalable approach ensured seamless integration into our analytics workflows. The insights improved inventory planning, pricing strategy, and competitive benchmarking. Working with them has enhanced operational efficiency and empowered our team to act confidently in a fast-changing retail environment.“ — Director of Retail Analytics
FAQ’s How can SKU normalization reduce errors in multi-store pricing analysis? By standardizing product names, volumes, and packaging formats, SKU normalization eliminates duplication and inconsistencies, enabling accurate comparisons across stores and regions. Can data scraping capture temporary promotions or limited-time offers? Yes, automated monitoring tracks real-time pricing updates, including flash sales, bundle offers, and seasonal discounts, ensuring insights reflect current market conditions. How does store-level location data improve inventory decisions? Analyzing availability across specific store locations helps optimize stock allocation, prevent shortages, and improve regional distribution strategies. Can historical data be used to anticipate market trends? Absolutely. Structured datasets allow trend analysis, helping forecast demand, pricing shifts, and promotional impact for strategic planning. Is it possible to integrate the collected data with existing dashboards? Yes, all datasets are structured and compatible with business intelligence platforms, reporting tools, and analytics dashboards for seamless visualization and decision-making.