Download
1 / 11
110 likes | 218 Vues
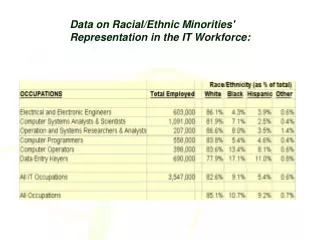
This analysis provides an overview of the representation of racial and ethnic minorities, as well as women in the IT workforce, highlighting significant statistics and trends. Furthermore, it examines the educational attainment of the El Paso population aged 25 and over between 1990 and 2000. Data indicates changes in educational levels and the implications for workforce diversity. The aim is to foster awareness and encourage initiatives for greater inclusivity and equity in IT-related fields.

E N D
Data on Racial/Ethnic Minorities' Representation in the IT Workforce: Data on Racial/Ethnic Minorities' Representation in the IT Workforce:
El Paso Educational Attainment in Population 25 Years and Over, 1990-2000 1990 2000 Number Percent of Total Number Percent of Total Total Population Age 25+ 327,999 100.00% 391,540 100.00% Less than 9th grade 77,659 23.68% 83,821 21.41% Some high school, no diploma 41,490 12.65% 50,187 12.82% High school graduate* 75,284 22.95% 88,256 22.54% Some college, no degree 66,952 20.41% 84,712 21.64% Associate degree 16,632 5.07% 19,538 4.99% Bachelor's degree 34,637 10.56% 43,262 11.05% Graduate or professional degree 15,345 4.68% 21,764 5.56%
IS Minority Faculty & Students Female Faculty Female Students Male Faculty MaleStudents