Download
1 / 14
140 likes | 254 Vues
Satellite Haze Detection on July July 16-18,1999. Rudolf B. Husar CAPITA, Washington University October 1999. The Haze Episode of July 16-18,1999.

E N D
Satellite Haze Detection on July July 16-18,1999 Rudolf B. Husar CAPITA, Washington University October 1999
The Haze Episode of July 16-18,1999 • Rich Poirot at Vermont and and Mario Benjamin have established that that July 16-17 was a major PM2.5 episode in the Northeastern US and Southeastern Canada. • Doug Westphal at the Naval Res. Lab has assimilated numerous data sets, and shown through a model that the haze on July 16 over the Northeast was most likely sulfate from long range transport from the Eastern US and SE Canada. • This work adds to the haze analysis of this haze episode by examining the color SeaWiFS satellite data, using a co-retrieval approach to simultaneously derive the haze optical characteristics and also to reconstruct the haze-free reflectance of the surface. • This early report on the July 16 satellite haze data analysis is shared for the purposes cooperation in analyzing this haze event.
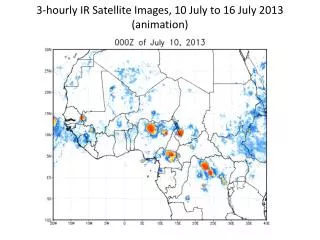
SeaWiFS Image of July 16, 1999 At noon on July 16, the ocean near the northeast coastline was free of clouds. However, a haze pall was observed from Delaware to Maine. The image is ‘truecolor’, synthesized from the red, green and blue channels of the SeaWiFS 8 channel sensor. Scattering due to air is removed to highlight the haze.
SeaWiFS Image of the Northeast, at 0.412 um At blue (0.412) wavelength, the haze reflectance is higher while the land surface reflectance is lower then at other wavelengths and virtually the entire reflectance is due to haze or clouds. Air scattering (not included) would add further reflectance in the blue. The surface features are obscured by haze and barely discernable. Hence, the blue wavelength is well suited for aerosol detection over land but surface detection is difficult .
SeaWiFS Image of the Northeast, at 0.555 um At green wavelength (0.555um) over land, the haze is reduced and the vegetation reflectance is increased. Haze and vegetation have comparable reflectance. The surface features are obscured by haze but discernable. Due to the low reflectance over, haze reflectance dominates. Hence, the green not well suited for haze detection over land but appropriate for haze detection the ocean and the detection of surface features.
SeaWiFS Image of the Northeast at Red 0.67 um At red wavelength (0.412) over land, dark vegetation is distinctly different from brighter yellow-gray soil. Over vegetation haze and plant have similar reflectance. The surface features, particularly water (darkest, R0<0.01), vegetation (dark, R0<0.04), and soil (brighter, R0<0.30) are are easily distinguishable. Due low water reflectance, haze reflectance dominates. Hence, the red is suitable for haze detection over dark vegetation and the ocean as well as for surface detection.
SeaWiFS Image of the Northeast, at 0.865 um In the near IR (0.865) over land, the surface reflectance is high (R0>0.30) over both vegetation and soil with only minor difference in brightens. Water on the other hand is completely dark (R0<0.01). Land and water are clearly distinguishable. The excess reflectance due to haze is barely perceptible. Due low water reflectance, haze reflectance dominates. Hence, the near IR is suitable for haze detection over water and land-water differentiation.
Low Haze SeaWiFS Image, July15-August 15, 1999 The haze and cloud-free image is derived from 29 days between July 15 and August 15, 1999 by retaining the lowest reflectance through the period. Clearly, some cloud and haze residues are still retained.
Reconstructed Haze-Free SurfaceDerived from removing the haze over vegetation and dark oceanThe imperfection of reconstructed surface is a measure of the retrieved haze
Aerosol Optical Thickness (AOT)Derived from the excess reflectance over vegetation and dark ocean
Aerosol Angstrom Exponent (AOT)Derived from the excess spectral reflectance over vegetation and dark ocean
Haze and Mist Patch Near Cape Cod Within the thicker haze defined here as mist, the slope of the spectral AOT is low (b<0.5) compared to the lighter haze (b>1.0). This indicates larger particles (D~0.6 um) in the mist. The aerosol optical thickness, AOT is ~ 0.3 (blue) over the much ocean surrounding Cape Cod. However, just to the the south, patches of thicker haze are seen, with AOT > 0.5. The blue areas of low Angstrom exponent (larger particle size) indicate sharply delineated patches of mist near Nantucket and Martha’s Vineyard Islands.
Surface Meteorological Data at Martha’s Vineyard • In the afternoon between noon and 8 PM, the relative humidity has increased from 50 to over 80%. • During that time, the reported visibility decreased from 10 mile (or higher) to 6 miles corresponding to a rise in Bext from 2.4 to 4.0 km-1. • Hence, the rise in Bext is likely due to the the rising humidity. • If the aerosol was composed of sulfate salts, the particles would likely deliquesce from crystals to droplets as the RH increases from 50 to 80%.
Summary of Haze Conditions • A haze plume from Eastern North America extended over the East Coast between Delaware and Maine. • Over sharply defined patches near Cape Cod, the haze turned into a thicker mist. The mist is distinguished from haze by more intense scattering and white appearance compared to bluish haze. • The above is based on SeaWiFS color satellite observations at local noon. • Meteorological data show that between noon and 8 PM the surface relative humidity has increased from 50 to 80% and the visibility declined from (over) 10 to 6 miles. • Any ideas on this? Write to me: rhusar@me.wustl.edu