Download
1 / 79
810 likes | 1.01k Vues
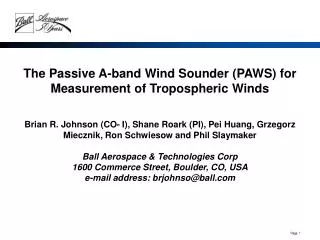
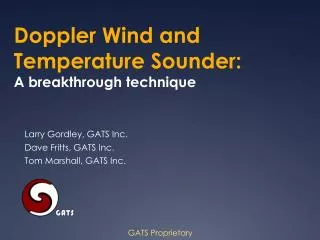
Doppler Wind and Temperature Sounder: A breakthrough technique. Larry Gordley, GATS Inc. Dave Fritts, GATS Inc. Tom Marshall, GATS Inc. GATS Proprietary. DWTS Instrument Overview. Specifications : Mass – 8 kg Power – 12 W Volume ~36x23x22 cm

E N D
Doppler Wind and Temperature Sounder:A breakthrough technique Larry Gordley, GATS Inc. Dave Fritts, GATS Inc. Tom Marshall, GATS Inc. GATS Proprietary
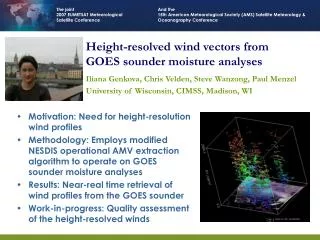
DWTS Instrument Overview • Specifications: • Mass – 8 kg • Power – 12 W • Volume ~36x23x22 cm • Data rate < 30 kbps with low alt wind • Three 5.0 cm aperture thermal IR cameras • NO (hi alt) 1829 – 1873 wn • 13CO2 (mid alt) 2258 – 2282 wn, • N2O (for low alt wind) 2120 – 2160 wn • Static limb viewing, 20° FOV at velocity normal • T, V, N2O and 13CO2 mixing ratios, VER (NO and CO2) Single telescope two-channel design above, has evolved to three independent cameras, below. GATS Proprietary
TemperatureMeasures Low Pressure Doppler Broadened Emission Line Width is proportional to square root of kinetic temperature
Single Atmospheric Emission line 1 ν (wavenumber, frequency) Emission lines are typically a few thousandths of a wavenumber wide, requiring optical resolving powers of 100,000 or more to measure. Typically, good spectrometers achieve 10,000. DWTS achieves >300,000. GATS Proprietary
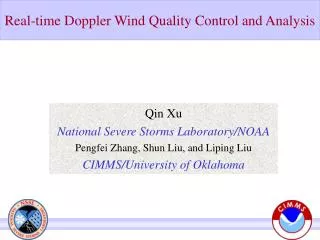
Doppler Shift Measurements Broadband emission will not detect Doppler shift, nor will spectra measurements, unless there is a zero shift reference
Atmospheric spectral emission from one line 0 signal shift, Δν ν (wavenumber, frequency) Doppler Spectral shift due to line-of-sight (LOS) relative air velocity GATS Proprietary
Atmospheric spectral emission from one line 0 signal shift, Δν 1 ν (wavenumber, frequency) Doppler Spectral shift due to line-of-sight (LOS) relative air velocity GATS Proprietary
Atmospheric spectral emission from one line 0 signal shift, Δν 1 ν (wavenumber, frequency) Doppler Spectral shift due to line-of-sight (LOS) relative air velocity GATS Proprietary
Atmospheric spectral emission from one line 0 signal shift, Δν 1 ν (wavenumber, frequency) Doppler Spectral shift due to line-of-sight (LOS) relative air velocity GATS Proprietary
Atmospheric spectral emission from one line 0 signal shift, Δν 1 ν (wavenumber, frequency) Doppler Spectral shift due to line-of-sight (LOS) relative air velocity GATS Proprietary
Atmospheric spectral emission from one line 0 signal shift, Δν 1 ν (wavenumber, frequency) Doppler Spectral shift due to line-of-sight (LOS) relative air velocity GATS Proprietary
Atmospheric spectral emission from one line 0 signal shift, Δν 1 ν (wavenumber, frequency) Doppler Spectral shift due to line-of-sight (LOS) relative air velocity GATS Proprietary
Atmospheric spectral emission from one line 0 signal shift, Δν 1 ν (wavenumber, frequency) Doppler Spectral shift due to line-of-sight (LOS) relative air velocity GATS Proprietary
Atmospheric spectral emission from one line 0 signal shift, Δν 1 ν (wavenumber, frequency) Doppler Spectral shift due to line-of-sight (LOS) relative air velocity GATS Proprietary
Atmospheric spectral emission from one line 0 signal shift, Δν 1 ν (wavenumber, frequency) Doppler Spectral shift due to line-of-sight (LOS) relative air velocity GATS Proprietary
Atmospheric spectral emission from one line 0 signal shift, Δν 1 ν (wavenumber, frequency) Doppler Spectral shift due to line-of-sight (LOS) relative air velocity GATS Proprietary
Atmospheric spectral emission from one line 0 signal shift, Δν 1 ν (wavenumber, frequency) Doppler Spectral shift due to line-of-sight (LOS) relative air velocity GATS Proprietary
Atmospheric spectral emission from one line 0 signal shift, Δν 1 ν (wavenumber, frequency) Doppler Spectral shift due to line-of-sight (LOS) relative air velocity GATS Proprietary
Atmospheric spectral emission from one line 0 signal shift, Δν ν (wavenumber, frequency) Doppler Spectral shift due to line-of-sight (LOS) relative air velocity GATS Proprietary
Atmospheric spectral emission from one line 0 signal shift, Δν ν (wavenumber, frequency) Doppler Spectral shift due to line-of-sight (LOS) relative air velocity GATS Proprietary
A Gas Filter ReferenceDWTS “Notch” filter ApproachBy viewing through a sample of the emitting gas, a filter is produced that causes a drop in signal during the Doppler Integration Pass (DIP) through the zero shift position
Cell Absorption and Atmospheric Emission 0 1 signal shift, Δν ν (wavenumber, frequency) Add Gas Cell – One Emission Line Example. Gas cell acts as high resolution notch filter and effectively serves as the zero shift reference point. The “shift, Δν ” is the spectral separation of the cell spectra (black absorption feature) from the observed atmospheric spectra (red emission feature). GATS Proprietary
Cell Absorption and Atmospheric Emission 0 1 signal shift, Δν ν (wavenumber, frequency) Add Gas Cell – One Emission Line Example GATS Proprietary
Cell Absorption and Atmospheric Emission 0 1 2 signal shift, Δν ν (wavenumber, frequency) Add Gas Cell – One Emission Line Example GATS Proprietary
Cell Absorption and Atmospheric Emission 0 1 signal shift, Δν ν (wavenumber, frequency) Δν Add Gas Cell – One Emission Line Example GATS Proprietary
Cell Absorption and Atmospheric Emission 0 1 signal shift, Δν 1 ν (wavenumber, frequency) Δν Add Gas Cell – One Emission Line Example GATS Proprietary
Cell Absorption and Atmospheric Emission 0 1 signal shift, Δν 1 ν (wavenumber, frequency) Δν Add Gas Cell – One Emission Line Example GATS Proprietary
Cell Absorption and Atmospheric Emission 0 1 signal shift, Δν 1 ν (wavenumber, frequency) Δν Add Gas Cell – One Emission Line Example GATS Proprietary
Cell Absorption and Atmospheric Emission 0 1 2 signal shift, Δν 1 ν (wavenumber, frequency) Δν Add Gas Cell – One Emission Line Example GATS Proprietary
Cell Absorption and Atmospheric Emission 0 1 signal shift, Δν 1 ν (wavenumber, frequency) Δν Add Gas Cell – One Emission Line Example GATS Proprietary
Cell Absorption and Atmospheric Emission 0 1 signal shift, Δν 1 ν (wavenumber, frequency) Δν Add Gas Cell – One Emission Line Example GATS Proprietary
Cell Absorption and Atmospheric Emission 0 1 signal shift, Δν 1 ν (wavenumber, frequency) Δν Add Gas Cell – One Emission Line Example GATS Proprietary
Cell Absorption and Atmospheric Emission 0 1 signal shift, Δν 1 ν (wavenumber, frequency) Δν Add Gas Cell – One Emission Line Example GATS Proprietary
Cell Absorption and Atmospheric Emission 0 1 signal shift, Δν 1 ν (wavenumber, frequency) Δν Add Gas Cell – One Emission Line Example GATS Proprietary
Cell Absorption and Atmospheric Emission 0 1 signal shift, Δν 1 ν (wavenumber, frequency) Δν Add Gas Cell – One Emission Line Example GATS Proprietary
Cell Absorption and Atmospheric Emission 0 1 signal shift, Δν 1 ν (wavenumber, frequency) Δν Add Gas Cell – One Emission Line Example GATS Proprietary
Cell Absorption and Atmospheric Emission 0 1 signal shift, Δν DIP width is proportional to square root of cell temperature + atmospheric temperature ν (wavenumber, frequency) Add Gas Cell – One Emission Line Example GATS Proprietary
Multi-line EffectThe emission lines that match the corresponding cell gas lines (i.e. “notch” filters), are scanned simultaneously, producing a DIP signal consistent with the total multi-line emission. The DIP width is the same as the single line DIP.
Cell Absorption & Atmospheric Emission, two lines 0 1 2 signal shift, Δν 1 2 ν (wavenumber, frequency) Two Line Example GATS Proprietary
Cell Absorption & Atmospheric Emission, two lines 0 1 2 signal shift, Δν 1 2 ν (wavenumber, frequency) Two Line Example GATS Proprietary
Cell Absorption & Atmospheric Emission, two lines 0 1 2 signal shift, Δν 1 2 ν (wavenumber, frequency) Two Line Example GATS Proprietary
Cell Absorption & Atmospheric Emission, two lines 0 1 2 signal shift, Δν 1 2 ν (wavenumber, frequency) Two Line Example GATS Proprietary
Cell Absorption & Atmospheric Emission, two lines 0 1 2 signal shift, Δν 1 2 ν (wavenumber, frequency) Two Line Example GATS Proprietary
Cell Absorption & Atmospheric Emission, two lines 0 1 2 signal shift, Δν 1 2 ν (wavenumber, frequency) Two Line Example GATS Proprietary
Cell Absorption & Atmospheric Emission, two lines 0 1 2 signal shift, Δν 1 2 ν (wavenumber, frequency) Two Line Example GATS Proprietary
Orbit ImplementationBy imaging the limb, normal to the spacecraft (SC) velocity vector, air parcels at all altitudes will produce a DIP signal as they traverse the FOV (i.e the 2D detector array).The animation tracks just one exaggerated Limb Air Volume (LAV).
Implementation, In-Orbit Observations Observation Angle Cell Absorption & Atmospheric Emission, two lines 0 1 2 signal shift, Δν 1 2 ν (wavenumber, frequency) Above, Spectra and Signal from one LAV Figures below depict observation geometry Limb Air Volume (LAV) viewed from above DWTS FOV Imaged on 2D Detector FPA 0° -10° +10° Angle from Velocity Normal Relative Air Velocity due to SC LAV SC Velocity Altitude y z Observation Vectors Δν (wavenumber) shift Limb Air Volume (LAV) GATS Proprietary Observations Through Limb Atmospheric Volume x
In-Orbit Observations Observation Angle Cell Absorption & Atmospheric Emission, two lines 0 1 2 signal shift, Δν 1 2 ν (wavenumber, frequency) Limb Air Volume (LAV) viewed from above DWTS FOV Imaged on 2D Detector FPA 0° -10° +10° Angle from Velocity Normal Relative Air Velocity due to SC SC Velocity Altitude y z Observation Vectors Δν (wavenumber) shift Limb Air Volume (LAV) GATS Proprietary Observations Through Limb Atmospheric Volume x
In-Orbit Observations Observation Angle Cell Absorption & Atmospheric Emission, two lines 0 1 2 signal shift, Δν 1 2 ν (wavenumber, frequency) Limb Air Volume (LAV) viewed from above DWTS FOV Imaged on 2D Detector FPA 0° -10° +10° Angle from Velocity Normal Relative Air Velocity due to SC SC Velocity Altitude y z Observation Vectors Δν (wavenumber) shift Limb Air Volume (LAV) GATS Proprietary Observations Through Limb Atmospheric Volume x
In-Orbit Observations Observation Angle Cell Absorption & Atmospheric Emission, two lines 0 1 2 1 2 signal shift, Δν 1 2 ν (wavenumber, frequency) Limb Air Volume (LAV) viewed from above DWTS FOV Imaged on 2D Detector FPA 0° -10° +10° Angle from Velocity Normal Relative Air Velocity due to SC SC Velocity Altitude y z Observation Vectors Δν (wavenumber) shift Limb Air Volume (LAV) GATS Proprietary Observations Through Limb Atmospheric Volume x