Unlocking PowerPoint Animations
110 likes | 231 Vues
Explore the intricacies of semiconductor detectors and their ability to generate more electron-hole pairs from incident gamma energy compared to other detectors. This guide will show you how to use PowerPoint animations effectively to illustrate complex concepts such as conduction band, valence band, and the photoelectric effect. Learn step-by-step techniques to create dynamic visuals: from using clipart graphics to adding animated elements like connectors and arrows. Engage your audience with captivating animations that clarify the mechanisms behind semiconductor detection.

Unlocking PowerPoint Animations
E N D
Presentation Transcript
Conduction Band Electron-hole Pair Valence Band The Key • Go from this……
To This…. • Semi-conductor detectors will produce significantly more information carriers (electron-hole pairs) for a given incident gamma energy than any other type of detector Conduction Band Electron-hole Pair Valence Band
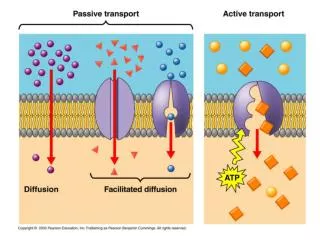
Photoelectric Effect Full Energy Pulse (FEP) Detector Signal
Adding Life to Procedures • Go from this to…….
How It’s Done • Start with a clipart graphic • Add a connector from AutoShapes and set it to wipe down • Add the explosion from the AutoShapes Stars and Banners. Set it to box out
How It’s Done • Draw a circle and fill it with red. Set it to appear • Draw an arrow and set it to wipe down • View the animation and adjust sequence or settings as needed
How It’s Done • Draw a circle and fill it with red. Set it to appear • Draw an arrow and set it to wipe down • View the animation and adjust sequence or settings as needed