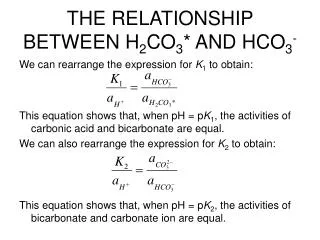
Download
1 / 21
220 likes | 396 Vues
Relationship Between Edge Zonal Flows and L-H Transitions in NSTX S. J. Zweben 1 , T. Munsat 2 , Y. Sechrest 2 , D. Battaglia 3 , S.M. Kaye 1 , S. Kubota 4 and the NSTX Team 1 Princeton Plasma Physics Laboratory, 2 University of Colorado 3 ORNL, Oak Ridge 4 UCLA, Los Angeles

E N D
Relationship Between Edge Zonal Flows and L-H Transitions in NSTX S. J. Zweben1, T. Munsat2, Y. Sechrest2, D. Battaglia3, S.M. Kaye1, S. Kubota4 and the NSTX Team 1 Princeton Plasma Physics Laboratory, 2 University of Colorado 3 ORNL, Oak Ridge 4 UCLA, Los Angeles EFTSOMP Workshop, Strasbourg July 6-7, 2011
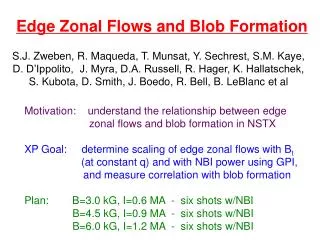
What Causes the L-H Transition ? Theoretical ideas: • Shearing of edge turbulence by mean (steady) flows • Shearing of edge turbulence by zonal (fluctuating) flows • Stabilization of L-mode instability without flow shearing ? Experimental evidence: • Clear evidence of improved confinement due to biasing • Clear evidence of turbulence reduction at L-H transition • But transition ‘trigger’ is still an open issue (Wagner ‘07) We don’t have a good answer yet !
Outline of this Talk • Latest fast camera movies of L-H transition on NSTX • Edge zonal flow spectra derived from these movies • Relationship between edge zonal flow and transition • Comparison with preliminary result from Alcator C-Mod
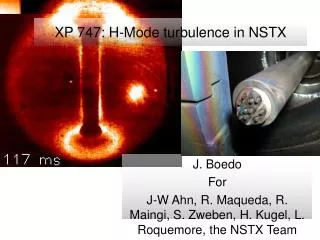
Gas Puff Imaging (GPI) Diagnostic • Optics view along B toward Da emission from D2 gas puff • Oriented to view 2-D radial vs. poloidal plane at gas puff GPI in NSTX GPI 4
Movie of L-H Transition in NSTX • Viewing area ~ 25 cm radially x 25 cm poloidally • This movie 285,000 frames/sec for ~ 3.5 msec sep. #135042 B=4.5 kG I=0.92 MA P=2.6 MW NBI L-H transition @ 0.2455 sec (EDD) poloidal (z) playback @ 50 µsec/sec 5 radial (outward)
What Are We Seeing in GPI ? • Seeing local emission of Da ~ no f(ne,Te)within window where Dais emitted in plasma edge, where Te~ 10 -100 eV • Can measure 2-D turbulence structure and motion even if response of Da is nonlinear (like contrast knob on a TV) • Can not directly measure fluid (ion) flowor ExB flow, but measures turbulence flow velocity, as done previously* * McKee et al, PoP ’03 using BES on DIII-D Conway et al, PPCF ’05 using Doppler reflectometry on AUG 6
L-H Transition NBI-Heated Case • Viewing area ~ 25 cm radially x 31 cm poloidally • This movie 400,000 frames/sec for ~ 2 msec #138114 B=4.4 kG I=0.91 MA P=1.3 MW NBI L-H transition @ 0.2530 sec (EDD) poloidal (z) playback @ 40 µsec/sec radial (outward)
L-H Transition RF-Heated Case • Viewing area ~ 25 cm radially x 31 cm poloidally • This movie 400,000 frames/sec for ~ 2 msec #141922 B=4.4 kG I=0.91 MA P=0.7 MW RF L-H transition @ 0.2378 sec (EDD) poloidal (z) playback @ 40 µsec/sec radial (outward)
L-H Transition in Ohmic Case • Viewing area ~ 25 cm radially x 31 cm poloidally • This movie 400,000 frames/sec for ~ 2 msec #141751 B=3.6 kG I=0.80 MA Ohmic L-H transition @ 0.2350 sec (EDD) poloidal (z) playback @ 40 µsec/sec radial (outward)
Method to Calculate Zonal Flows one frame - for each pixel in each frame, make a short time series of the normalized GPI signal at that pixel over a ~ 40 µs interval - find highest cross-correlation to this time series in pixels of the next frame and get 2-D velocity from the displacement - average ~25 cm poloidally to get “zonal flow” velocity 10
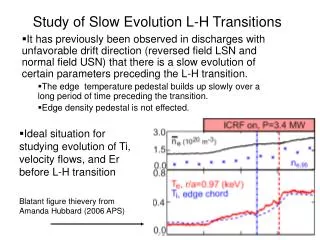
Zonal Flow Spectrum in NBI Case • See near-coherent peak at ~ 3 kHz preceding transition L H Vpol spectrum just inside separatrix
Zonal Flow Spectrum in RF Case • See broadband, intermittent spectrum preceding transition • Dithering of H to L to H etc. in Da starts at 243 msec L H + dithering Vpol spectrum just inside separatrix
Zonal Flow Spectrum in Ohmic Case • See near-coherent peak at ~ 3 kHz preceding transition Ohmic H-mode Vpol spectrum just inside separatrix
Radial Profile of ZF- NBI Case • L-H transition at 253 msec Vpol spectrum vs. time
Radial Profile of ZF - RF Case • L-H transition at 238 msec Vpol spectrum vs. time
Radial Profile of ZF– OH Case • L-H transition at 235 msec Vpol spectrum vs. time
Relationship of ZF and Transition ? L H Lpol (cm) • Fsol • Look at changes in Vpol and turbulence before L-H transition • No obvious ‘trigger event’, e.g. at r ~ 0.4 cm in NBI transition* Lrad (cm) Vpol (km/s) (µs) S=(dVpol/dr) • (Lr/Lp)t time (sec) time (sec) *Zweben et al, POP ‘10 ; Sechrest et al, POP ‘11
Shear Flow Preceding Transition • Evaluate S = (dVpol/dr)(Lr/Lp)t for 9 similar NBI transitions* • No clear, systematic increase in S just before transition L H L H *Zweben et al, POP ’10
Summary of NSTX Results • See clear reduction in edge turbulence at L-H transition • Often see coherent zonal flow preceding L-H transition • But sometimes see broadband, intermittent flow instead • No clear increase in zonal flow or shear before transition Causal relationship between zonal flow and L-H transition not yet clear !
Comparison with Alcator C-Mod w/ J. Terry, D. Pace, T. Golfinopolos and the Alcator Group • Coherent Vpol @ ~ 6.5 kHz before RF-induced L-H transition • Good correlation of Vpol with Bdot (probably n=0) - EGAM ? correlation of Vpol with Bdot L H
Questions for Discussion ? • How can we identify cause of L-H transition experimentally ? • How can we establish quantitative connection with theory ?