Manifold Flow Predictor: Efficient Simulation and Management of Fluid Dynamics
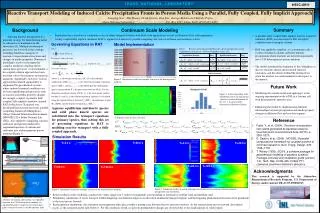
The Manifold Flow Predictor (MFP) offers a user-friendly interface for modeling fluid dynamics from a single source to multiple outlets in scientific and industrial applications. Users can define manifold geometry, input fluid properties, and set boundary conditions to simulate flows. Key features include secure job submission for multiple users via HPC systems, retrieval of past projects, and comprehensive visualization of results using ParaView. Future enhancements aim to improve security, user experience, and simulation accuracy, focusing on scalable and converged results.

Manifold Flow Predictor: Efficient Simulation and Management of Fluid Dynamics
E N D
Presentation Transcript
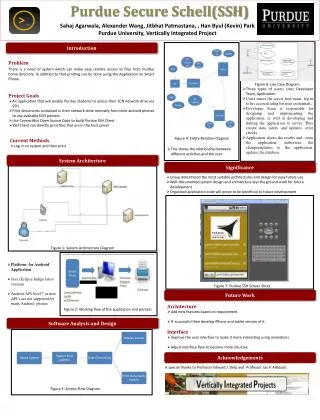
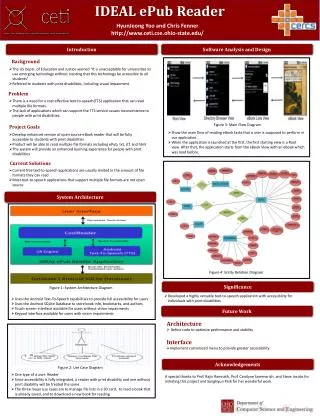
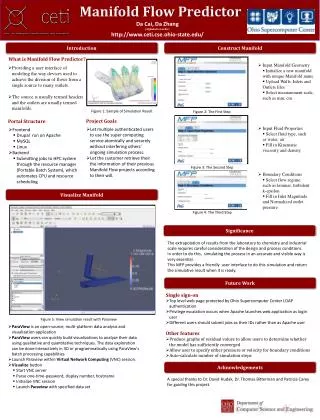
What is Manifold Flow Predictor? • Providing a user interface of modeling the way devices used to achieve the division of flows from a single source to many outlets. • The source is usually termed headers and the outlets are usually termed manifolds. Portal Structure • Frontend • Drupal run on Apache • MySQL • Linux • Backend • Submitting jobs to HPC system through the resource manager (Portable Batch System), which automates CPU and resource scheduling Project Goals • Let multiple authenticated users to use the super computing service atomically and securely without interfering others’ ongoing simulation process. • Let the customer retrieve their the information of their previous Manifold Flow projects according to their will. Manifold Flow Predictor DaCai, Da Zhang (Alphabetical order) http://www.ceti.cse.ohio-state.edu/ Introduction Construct Manifold • Input Manifold Geometry • Initialize a new manifold with unique Manifold name • Upload Walls, Inlets and Outlets files • Select measurement scale, such as mm, cm Figure 1: Sample of Simulation Result Figure 2: The First Step • Input Fluid Properties • Select fluid type, such as water, air • Fill in Kinematic viscosity and density Figure 3: The Second Step • Boundary Conditions • Select flow regime, such as laminar, turbulent k-epsilon • Fill in Inlet Magnitude and Normalized outlet pressure Visualize Manifold Figure 4: The Third Step Significance The extrapolation of results from the laboratory to chemistry and industrial scale requires careful consideration of the design and process conditions. In order to do this, simulating the process in an accurate and visible way is very essential. This MFP provides a friendly user interface to do this simulation and return the simulative result when it is ready. Future Work • Single sign-on • Top level web page protected by Ohio Supercomputer Center LDAP authentication • Privilege escalation occurs when Apache launches web application as login user • Different users should submit jobs as their IDs rather than as Apache user • Other features • Produce graphs of residual values to allow users to determine whether the model has sufficiently converged • Allow user to specify either pressure or velocity for boundary conditions • Auto-calculate number of simulation steps Figure 5: View simulation result with Paraview • ParaView is an open-source, multi-platform data analysis and visualization application • ParaView users can quickly build visualizations to analyze their data using qualitative and quantitative techniques. The data exploration can be done interactively in 3D or programmatically using ParaView's batch processing capabilities • Launch Paraview within Virtual Network Computing (VNC) session. • Visualize button • Start VNC server • Parse one-time-password, display number, hostname • Initialize VNC session • Launch Paraviewwith specified data set Acknowledgements • A special thanks to Dr. David Hudak, Dr. Thomas Bittermanand Patricia Carey for guiding this project.