Download
1 / 2

E N D
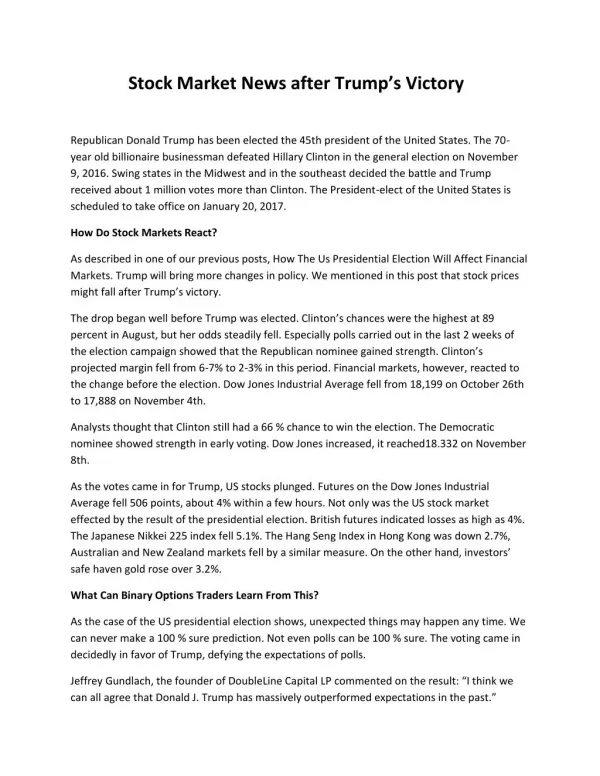
Markets for You 01 October 2015 Indices Performance Global Indices % Change# • Most of the Asian markets closed in green following improvement in commodity markets and value buying. Today (As on Thursday), Asian stocks opened higher, tracking gains in the Wall Street overnight. Meanwhile, manufacturing activity in China improved in September after the government's official Purchasing Managers' Index edged up to 49.8 from a three-year low of 49.7 in August. Hang Seng was trading up 1.41% and Nikkei Average was trading up 0.25% (as at 8.00 a.m IST). • As per last closing, European equities surged and closed sharply higher following a rally in global equity markets. Mining stocks rebounded after a major mining company reassured investors that it has taken proactive steps to position the company to withstand current commodity market conditions. • As per last closing, U.S. equities rallied and closed sharply higher following a rally in global markets across Europe and Asia-pacific region. Market sentiment was also boosted after private sector job growth in September came better than expected. However, investors remained on the sidelines ahead of the key U.S. jobs data due October 2. Global Indices 30-Sep Prev_Day Abs. Change Dow Jones 16,285 16,049 236 1.47 Nasdaq 4,620 4,517 103 2.28 FTSE 6,062 5,909 152 2.58 Nikkei 17,388 16,931 457 2.70 Hang Seng 20,846 20,557 290 1.41 % Change# Indian Indices 30-Sep Prev_Day Abs. Change S&P BSE Sensex 26,155 25,779 376 1.46 CNX Nifty 7,949 7,843 106 1.35 CNX 100 8,068 7,953 115 1.44 Bank Nifty 17,216 17,281 -65 -0.38 SGX Nifty 7,949 7,953 -4 -0.05 Indian Equity Market S&P BSE Power 1,842 1,808 34 1.88 • Indian equity markets rose as investors continued to take positive cues from higher-than-expected repo rate cut of 50 bps by the Reserve Bank of India. Strength in Asian markets further boosted investor sentiments. • Key benchmark indices, S&P BSE Sensex and CNX Nifty, rose 1.46% and 1.35% to close at 26,154.83 points and 7,948.90 points, respectively. Moreover, S&P BSE Mid-Cap and S&P BSE Small-Cap rose 1.71% and 1.07%, respectively. • The overall market breadth on BSE was positive with 1,672 scrips advancing and 1,001 scrips declining. A total of 101 scrips remained unchanged. • On the BSE sectoral front, barring S&P BSE Bankex, all the indices closed in green. S&P BSE Metal was the top gainer, up 3.36%, followed by S&P BSE FMCG and S&P BSE TECk, which rose 2.36% and 2.07%, respectively. S&P BSE Realty and S&P BSE Power rose 2.05% and 1.88%. Stocks of metal sector recovered following overnight rally in commodity prices. S&P BSE Small Cap 11,021 10,904 117 1.07 S&P BSE HC 17,779 17,480 300 1.71 P/E Dividend Yield Sensex Nifty Date P/E Div. Yield P/E Div. Yield 30-Sep 21.11 1.39 22.21 1.46 Month Ago 21.14 1.39 22.17 1.48 Year Ago 18.24 1.28 20.82 1.31 Nifty Top 3 Gainers % Change# Company 30-Sep Prev_Day Idea Cellular 150 140 7.02 Cairn India 153 145 5.69 Tata Steel 213 201 5.56 Nifty Top 3 Losers Domestic News % Change# • Infrastructure output grew 2.6% on a yearly basis in August, much faster than 1.1% seen in the previous month. The growth in the reported month was mainly contributed by higher generation of cement and electricity. On the contrary, steel production contracted 5.9% compared to 5.6% rise in July. • The Reserve Bank of India said India's external debt rose by $8.5 billion on a quarterly basis to $482.9 billion. The rise was mainly due to higher non-resident Indian deposits and commercial borrowings. The share of short-term debt residual maturity to India's forex reserves fell to 51.9% from 54.2% in March end. • According to the World Economic Forum report, India has moved up 16 places on the Global Competitiveness Index. It now ranks 55th among 140 countries against 71st in 2014-15. Despite this improvement, India still ranks seven notches lower than it did in 2007. • The Foreign Investment Promotion Board gave approval to 18 foreign investment proposals. However, five proposals were deferred and eight were rejected. In June, India had attracted $2.05 billion FDI against $1.92 billion in the same month last fiscal. • The Government has cut natural gas prices by 16% to $4.24 per million British thermal unit on Net Calorific Value basis for the period of next six month, beginning October 1, as per a formula approved by the Government in October 2014. • Reliance Communications Ltd. will partner with Reliance Industries Ltd.'s telecom subsidiary to launch fourth-generation (4G) mobile phone services by year-end. • Engineering and construction major Larsen & Toubro said its construction arm has won contracts worth Rs. 1,376 core in power transmission and distribution business in September. Company 30-Sep Prev_Day Tech Mahindra 557 570 -2.29 Bank of Baroda 183 187 -2.16 SBI 237 242 -1.96 Advance Decline Ratio BSE NSE Advances 1672 1019 Declines 1001 482 Unchanged 101 68 Institutional Flows (Equity) Inflow/Outflow Description (Cr) YTD -1111 FII Flows* 21047 1032 MF Flows** 57005 *30th Sep 2015; **29th Sep 2015 Economic Indicator Quarter Ago YoY(%) Current Year Ago -4.95% (Aug-15) 4.20% (Jul-15) -2.20% (May-15) 3.00% (Apr-15) 3.85% (Aug-14) 0.90% (Jul-14) WPI IIP 7.50 7.00 (Jun-15) 6.70 GDP (Mar-15) (Jun -14)
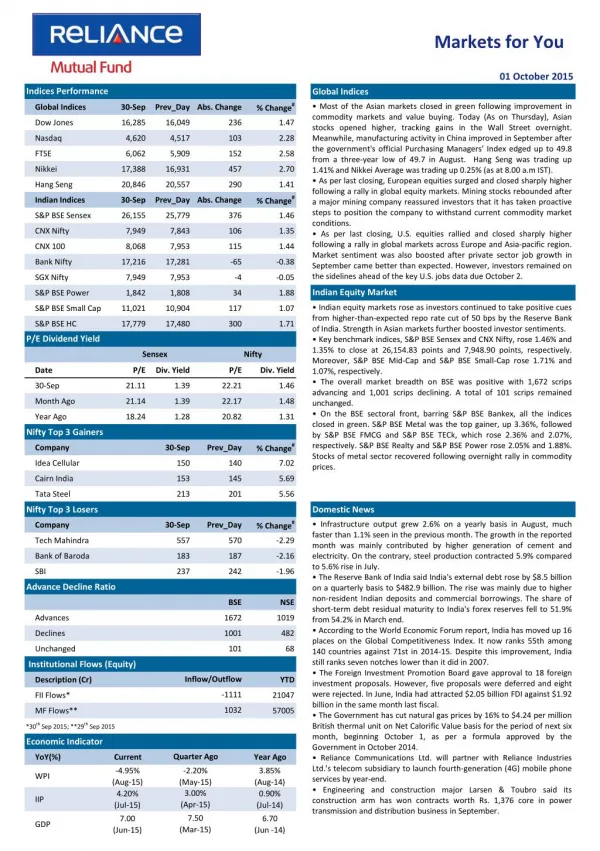
Markets for You 01 October 2015 Derivatives Market FII Derivative Trade Statistics 30-Sep • Nifty October 2015 Futures were at 7,980.35 points, a premium of 31.45 points against the spot closing of 7,948.90 points. The turnover on NSE’s Futures and Options segment fell from Rs. 2,74,905.19 crore on September 29 to Rs. 1,63,185.87 crore on September 30. • The Put-Call ratio stood at 0.89, compared to the previous session’s close of 0.85. • The Nifty Put-Call ratio stood at 0.92 compared to the previous session’s close of 0.91. • The open interest on Nifty Futures stood at 19.79 million, compared to the previous session’s close of 19.84 million. (Rs Cr) Buy Sell Open Int. Index Futures 2538.80 3057.68 17274.62 Index Options 21145.83 17530.87 59365.61 Stock Futures 3013.44 2878.51 43336.48 Stock Options 2054.35 2038.49 1074.54 Total 28752.42 25505.55 121051.25 Derivative Statistics- Nifty Options 30-Sep Prev_Day Change Indian Debt Market Put Call Ratio (OI) 0.92 0.92 0.00 • Bond yields extended the previous day’s fall after the Central Bank cut its repo rate by 50 bps, which was larger than market expectations. Relaxation in foreign investment limit in phases in Government debt provided further support. • The yield on the 10-year benchmark bond, 7.72% GS 2025, fell by 7 bps to close at 7.54% compared to the previous close of 7.61%. The paper moved in the range of 7.52% to 7.58% during the trading session. •Banks’ borrowings under the repo window of the Liquidity Adjustment Facility stood at Rs. 9,037 crore (gross) against Rs. 17,765 crore borrowed on September 29. Sale of securities by the Central Bank under the reverse repo window stood at Rs. 16,595 crore on September 29. Put Call Ratio(Vol) 0.97 0.97 0.00 Debt Watch 30-Sep Wk. Ago Mth. Ago Year Ago Call Rate 6.86% 7.21% 7.09% 7.99% CBLO 6.60% 7.30% 7.21% 7.66% Repo 6.75% 7.25% 7.25% 8.00% Reverse Repo 5.75% 6.25% 6.25% 7.00% 91 Day T-Bill 7.02% 7.42% 7.20% 8.40% 364 Day T-Bill 7.14% 7.42% 7.51% 8.61% 10 Year Gilt 7.54% 7.72% 7.78% 8.51% Currency Market Update • The rupee extended the previous day’s gains against the dollar after the Reserve Bank of India cut repo rate by a higher-than-expected 50 bps. The rupee inched up 0.12% to 65.58 per dollar from the previous close of 65.96. The domestic currency also recorded its biggest monthly appreciation in the last eight months. • The euro fell against the dollar after Euro zone inflation contracted annually in September, increasing expectations that the ECB will expand its asset purchase program. The euro was trading at $1.1211 compared to the previous close of $1.1243. G-Sec Vol. (Rs.Cr) 85465 24945 30399 41065 1 Month CP Rate 7.36% 7.79% 7.54% 8.95% 3 Month CP Rate 7.51% 7.93% 7.83% 8.91% 5 Year Corp Bond 8.27% 8.39% 8.36% 9.21% 1 Month CD Rate 7.08% 7.58% 7.30% 8.63% 3 Month CD Rate 7.18% 7.63% 7.50% 8.64% 1 Year CD Rate 7.33% 7.84% 7.83% 9.03% Currency Market Commodity Market Update • Gold prices fell as data showed that U.S. non-farm private employment rose more than expected in September. • Brent crude prices fell as investors remained on sidelines ahead of the weekly report on oil supplies from the U.S. Energy Information Administration, due later during the day. Currency 30-Sep Prev_Day Change USD/INR 65.74 66.18 -0.44 GBP/INR 99.53 100.46 -0.93 International News EURO/INR 73.80 74.61 -0.81 • Consumer confidence index in the U.S. unexpectedly improved to 103.0 in September from 101.3 in the previous month. The rise was fuelled by the more positive assessment of current conditions while expectations index edged down. • As per flash data, Euro zone inflation unexpectedly contracted by 0.1% on a yearly basis in September compared to 0.1% rise in August. It was the first fall in six months. Core inflation rose by 0.9%, similar to what was seen in August. JPY/INR 0.55 0.55 -0.01 Commodity Prices Currency 30-Sep Wk Ago Mth. Ago Year Ago NYMEX Crude($/bl) 45.06 44.53 45.29 91.17 Brent Crude($/bl) 47.04 48.10 47.67 94.42 Gold( $/oz) 1115 1130 1134 1209 Gold(Rs./10 gm) 25979 26146 26371 26772 Source: ICRON Research Disclaimer: “The information herein is meant only for general reading purposes and contains all factual and statistical information pertaining to Industry and markets which have been obtained from independent third-party sources and which are deemed to be reliable. The information provided cannot be considered as guidelines, recommendations or as a professional guide for the readers. It may be noted that since RCAM has not independently verified the accuracy or authenticity of such information or data, or for that matter the reasonableness of the assumptions upon which such data and information has been processed or arrived at; RCAM does not in any manner assures the accuracy or authenticity of such data and information. Some of the statements & assertions contained in these materials may reflect RCAM’s views or opinions, which in turn may have been formed on the basis of such data or information. The Sponsor, the Investment Manager, the Trustee or any of their respective directors, employees, affiliates or representatives do not assume any responsibility for, or warrant the accuracy, completeness, adequacy and reliability of such data or information. Whilst no action has been solicited based upon the information provided herein, due care has been taken to ensure that the facts are accurate and opinions given are fair and reasonable, to the extent possible. This information is not intended to be an offer or solicitation for the purchase or sale of any financial product or instrument. Recipients of this information should rely on information/data arising out of their own investigations. Before making any investments, the readers are advised to seek independent professional advice, verify the contents in order to arrive at an informed investment decision. None of the Sponsor, the Investment Manager, the Trustee, their respective directors, employees, affiliates or representatives shall be liable in any way for any direct, indirect, special, incidental, consequential, punitive or exemplary damages, including on account of lost profits arising from the information contained in this material. Mutual Fund Investments are subject to market risks, read all scheme related documents carefully.