Download
1 / 2
20 likes | 122 Vues
A monthly income plan, is one that invests mostly into debt securities, as they are less risky, they have several benefits for investors that are risk averse or have a lower appetite for risk.

E N D
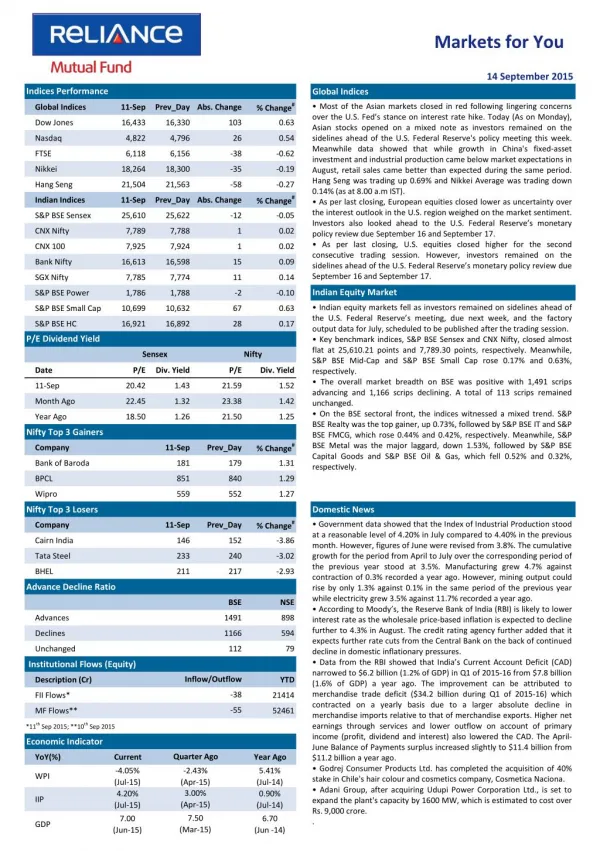
Markets for You 14 September 2015 Indices Performance Global Indices % Change# • Most of the Asian markets closed in red following lingering concerns over the U.S. Fed’s stance on interest rate hike. Today (As on Monday), Asian stocks opened on a mixed note as investors remained on the sidelines ahead of the U.S. Federal Reserve's policy meeting this week. Meanwhile data showed that while growth in China's fixed-asset investment and industrial production came below market expectations in August, retail sales came better than expected during the same period. Hang Seng was trading up 0.69% and Nikkei Average was trading down 0.14% (as at 8.00 a.m IST). • As per last closing, European equities closed lower as uncertainty over the interest outlook in the U.S. region weighed on the market sentiment. Investors also looked ahead to the U.S. Federal Reserve’s monetary policy review due September 16 and September 17. • As per last closing, U.S. equities closed higher for the second consecutive trading session. However, investors remained on the sidelines ahead of the U.S. Federal Reserve’s monetary policy review due September 16 and September 17. Global Indices 11-Sep Prev_Day Abs. Change Dow Jones 16,433 16,330 103 0.63 Nasdaq 4,822 4,796 26 0.54 FTSE 6,118 6,156 -38 -0.62 Nikkei 18,264 18,300 -35 -0.19 Hang Seng 21,504 21,563 -58 -0.27 % Change# Indian Indices 11-Sep Prev_Day Abs. Change S&P BSE Sensex 25,610 25,622 -12 -0.05 CNX Nifty 7,789 7,788 1 0.02 CNX 100 7,925 7,924 1 0.02 Bank Nifty 16,613 16,598 15 0.09 SGX Nifty 7,785 7,774 11 0.14 Indian Equity Market S&P BSE Power 1,786 1,788 -2 -0.10 • Indian equity markets fell as investors remained on sidelines ahead of the U.S. Federal Reserve’s meeting, due next week, and the factory output data for July, scheduled to be published after the trading session. • Key benchmark indices, S&P BSE Sensex and CNX Nifty, closed almost flat at 25,610.21 points and 7,789.30 points, respectively. Meanwhile, S&P BSE Mid-Cap and S&P BSE Small Cap rose 0.17% and 0.63%, respectively. • The overall market breadth on BSE was positive with 1,491 scrips advancing and 1,166 scrips declining. A total of 113 scrips remained unchanged. • On the BSE sectoral front, the indices witnessed a mixed trend. S&P BSE Realty was the top gainer, up 0.73%, followed by S&P BSE IT and S&P BSE FMCG, which rose 0.44% and 0.42%, respectively. Meanwhile, S&P BSE Metal was the major laggard, down 1.53%, followed by S&P BSE Capital Goods and S&P BSE Oil & Gas, which fell 0.52% and 0.32%, respectively. S&P BSE Small Cap 10,699 10,632 67 0.63 S&P BSE HC 16,921 16,892 28 0.17 P/E Dividend Yield Sensex Nifty Date P/E Div. Yield P/E Div. Yield 11-Sep 20.42 1.43 21.59 1.52 Month Ago 22.45 1.32 23.38 1.42 Year Ago 18.50 1.26 21.50 1.25 Nifty Top 3 Gainers % Change# Company 11-Sep Prev_Day Bank of Baroda 181 179 1.31 BPCL 851 840 1.29 Wipro 559 552 1.27 Nifty Top 3 Losers Domestic News % Change# • Government data showed that the Index of Industrial Production stood at a reasonable level of 4.20% in July compared to 4.40% in the previous month. However, figures of June were revised from 3.8%. The cumulative growth for the period from April to July over the corresponding period of the previous year stood at 3.5%. Manufacturing grew 4.7% against contraction of 0.3% recorded a year ago. However, mining output could rise by only 1.3% against 0.1% in the same period of the previous year while electricity grew 3.5% against 11.7% recorded a year ago. • According to Moody’s, the Reserve Bank of India (RBI) is likely to lower interest rate as the wholesale price-based inflation is expected to decline further to 4.3% in August. The credit rating agency further added that it expects further rate cuts from the Central Bank on the back of continued decline in domestic inflationary pressures. • Data from the RBI showed that India’s Current Account Deficit (CAD) narrowed to $6.2 billion (1.2% of GDP) in Q1 of 2015-16 from $7.8 billion (1.6% of GDP) a year ago. The improvement can be attributed to merchandise trade deficit ($34.2 billion during Q1 of 2015-16) which contracted on a yearly basis due to a larger absolute decline in merchandise imports relative to that of merchandise exports. Higher net earnings through services and lower outflow on account of primary income (profit, dividend and interest) also lowered the CAD. The April- June Balance of Payments surplus increased slightly to $11.4 billion from $11.2 billion a year ago. • Godrej Consumer Products Ltd. has completed the acquisition of 40% stake in Chile's hair colour and cosmetics company, Cosmetica Naciona. • Adani Group, after acquiring Udupi Power Corporation Ltd., is set to expand the plant's capacity by 1600 MW, which is estimated to cost over Rs. 9,000 crore. . Company 11-Sep Prev_Day Cairn India 146 152 -3.86 Tata Steel 233 240 -3.02 BHEL 211 217 -2.93 Advance Decline Ratio BSE NSE Advances 1491 898 Declines 1166 594 Unchanged 112 79 Institutional Flows (Equity) Inflow/Outflow Description (Cr) YTD -38 FII Flows* 21414 -55 MF Flows** 52461 *11th Sep 2015; **10th Sep 2015 Economic Indicator Quarter Ago YoY(%) Current Year Ago -4.05% (Jul-15) 4.20% (Jul-15) -2.43% (Apr-15) 3.00% (Apr-15) 5.41% (Jul-14) 0.90% (Jul-14) WPI IIP 7.50 7.00 (Jun-15) 6.70 GDP (Mar-15) (Jun -14)
Markets for You 14 September 2015 Derivatives Market FII Derivative Trade Statistics 11-Sep • Nifty September 2015 Futures were at 7,789.35, a premium of 0.05 points against the spot closing of 7,789.30 points. The turnover on NSE’s Futures and Options segment fell from Rs. 2,03,808.14 crore on September 10 to Rs. 1,77,759.19 crore on September 11. • The Put-Call ratio stood at 0.93, compared to the previous session’s close of 0.83. • The Nifty Put-Call ratio stood at 0.93, compared to the previous session’s close of 0.95. • The open interest on Nifty Futures stood at 25.09 million compared to the previous session’s close of 24.95 million. (Rs Cr) Buy Sell Open Int. Index Futures 1770.55 2042.73 22342.78 Index Options 17016.07 16659.18 92236.98 Stock Futures 2360.14 2047.78 45764.52 Stock Options 1850.62 1963.93 2452.83 Total 22997.38 22713.62 162797.11 Derivative Statistics- Nifty Options 11-Sep Prev_Day Change Indian Debt Market Put Call Ratio (OI) 0.93 0.95 -0.03 • Bond yields closed steady for the third consecutive session as investors remained on sidelines ahead of key inflation data and the U.S. Federal Reserve’s monetary policy review, due next week. • The yield on the 10-year benchmark bond, 7.72% GS 2025, closed unchanged at 7.77%. The paper moved in the range of 7.77% to 7.79% during the trading session. •Banks’ borrowings under the repo window of the Liquidity Adjustment Facility stood at Rs. 5,317 crore (gross) against Rs. 19,300 crore borrowed on September 10. Sale of securities by the RBI under the reverse repo window stood at Rs. 8,443 crore on September 10. • Banks did not borrow under the RBI’s Marginal Standing facility on September 10 compared to that of September 9 when it borrowed Rs. 30 crore. Put Call Ratio(Vol) 0.97 0.86 0.11 Debt Watch 11-Sep Wk. Ago Mth. Ago Year Ago Call Rate 7.08% 7.08% 7.09% 7.77% CBLO 7.06% 6.85% 7.20% 7.63% Repo 7.25% 7.25% 7.25% 8.00% Reverse Repo 6.25% 6.25% 6.25% 7.00% 91 Day T-Bill 7.44% 7.10% 7.21% 8.57% 364 Day T-Bill 7.43% 7.46% 7.56% 8.67% 10 Year Gilt 7.77% 7.75% 7.80% 8.51% Currency Market Update G-Sec Vol. (Rs.Cr) 24746 30876 22092 34791 • The rupee weakened against the dollar on the back of sustained demand for the greenback from banks and importers. The rupee fell by 0.16% to close at 66.54 compared to the previous close of 66.43. • The euro strengthened against the greenback on the back of weak U.S. import-export data for August. Continued uncertainty over the interest rate outlook in the U.S. region also weighed on market sentiments. The euro was trading higher at $1.1288 compared to the previous close of $1.1276. 1 Month CP Rate 7.83% 7.58% 7.48% 8.85% 3 Month CP Rate 8.00% 7.83% 7.79% 9.05% 5 Year Corp Bond 8.45% 8.41% 8.42% 9.32% 1 Month CD Rate 7.54% 7.43% 7.29% 8.73% 3 Month CD Rate 7.66% 7.51% 7.47% 8.74% 1 Year CD Rate 7.86% 7.83% 7.88% 9.06% Currency Market Commodity Market Update • Gold prices fell as uncertainty over the timing of an interest rate hike by the U.S. Fed kept investors on the sidelines. • Brent crude prices fell after Goldman Sachs cut its crude oil price forecasts, citing global over-supply and concerns over the health of the Chinese economy. Currency 11-Sep Prev_Day Change USD/INR 66.39 66.58 -0.20 GBP/INR 102.59 102.29 0.30 International News EURO/INR 74.90 74.71 0.18 • The Russian Central Bank held its key interest rate unchanged after five reductions this year, citing risks of higher inflation and a sharp economic slowdown. • Data from the Office for National Statistics showed that the U.K. construction output decreased unexpectedly in July after recovering in the previous month. The volume of construction output fell a seasonally adjusted 1.0% on a monthly basis in July, reversing a 0.9% increase in June. • Final data from Destatis showed that German consumer price inflation remained stable as initially estimated in August. The Consumer Price Index rose 0.2% on a yearly basis, the same figure as in July. On a monthly basis, consumer prices remained flat in August after rising 0.2% in July. JPY/INR 0.55 0.55 0.00 Commodity Prices Currency 11-Sep Wk Ago Mth. Ago Year Ago NYMEX Crude($/bl) 44.75 46.02 43.11 92.89 Brent Crude($/bl) 46.32 48.04 46.83 96.37 Gold( $/oz) 1108 1123 1109 1240 Gold(Rs./10 gm) 26001 26325 25264 26975 Source: ICRON Research Disclaimer: “The information herein is meant only for general reading purposes and contains all factual and statistical information pertaining to Industry and markets which have been obtained from independent third-party sources and which are deemed to be reliable. The information provided cannot be considered as guidelines, recommendations or as a professional guide for the readers. It may be noted that since RCAM has not independently verified the accuracy or authenticity of such information or data, or for that matter the reasonableness of the assumptions upon which such data and information has been processed or arrived at; RCAM does not in any manner assures the accuracy or authenticity of such data and information. Some of the statements & assertions contained in these materials may reflect RCAM’s views or opinions, which in turn may have been formed on the basis of such data or information. The Sponsor, the Investment Manager, the Trustee or any of their respective directors, employees, affiliates or representatives do not assume any responsibility for, or warrant the accuracy, completeness, adequacy and reliability of such data or information. Whilst no action has been solicited based upon the information provided herein, due care has been taken to ensure that the facts are accurate and opinions given are fair and reasonable, to the extent possible. This information is not intended to be an offer or solicitation for the purchase or sale of any financial product or instrument. Recipients of this information should rely on information/data arising out of their own investigations. Before making any investments, the readers are advised to seek independent professional advice, verify the contents in order to arrive at an informed investment decision. None of the Sponsor, the Investment Manager, the Trustee, their respective directors, employees, affiliates or representatives shall be liable in any way for any direct, indirect, special, incidental, consequential, punitive or exemplary damages, including on account of lost profits arising from the information contained in this material. Mutual Fund Investments are subject to market risks, read all scheme related documents carefully.