Download
1 / 1
10 likes | 119 Vues
Autocorrelation ( ρ). Distance (m). Lichen height as a management tool in reindeer husbandry. Anna Olofsson 1 , Öje Danell 1 , Pär Forslund 2 & Birgitta Åhman 1 Reindeer Husbandry Unit 1 & Ecology Department 2 , SLU, Uppsala, Sweden. Background

E N D
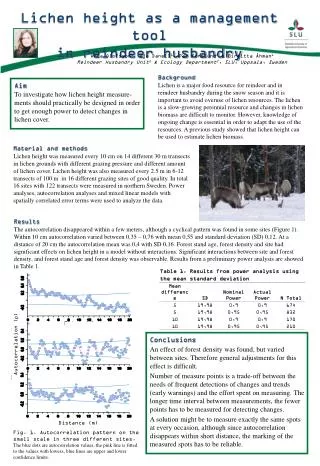
Autocorrelation (ρ) Distance (m) Lichen height as a management tool in reindeer husbandry Anna Olofsson1, Öje Danell1, Pär Forslund2 & Birgitta Åhman1 Reindeer Husbandry Unit1 & Ecology Department2, SLU, Uppsala, Sweden Background Lichen is a major food resource for reindeer and in reindeer husbandry during the snow season and it is important to avoid overuse of lichen resources. The lichen is a slow-growing perennial resource and changes in lichen biomass are difficult to monitor. However, knowledge of ongoing change is essential in order to adapt the use of the resources. A previous study showed that lichen height can be used to estimate lichen biomass. Aim To investigate how lichen height measure-ments should practically be designed in order to get enough power to detect changes in lichen cover. Material and methods Lichen height was measured every 10 cm on 14 different 30 m transects in lichen grounds with different grazing pressure and different amount of lichen cover. Lichen height was also measured every 2.5 m in 6-12 transects of 100 m in 16 different grazing sites of good quality. In total 16 sites with 122 transects were measured in northern Sweden. Power analyses, autocorrelation analyses and mixed linear models with spatially correlated error terms were used to analyze the data. Results The autocorrelation disappeared within a few meters, although a cyclical pattern was found in some sites (Figure 1). Within 10 cm autocorrelation varied between 0,35 – 0,76 with mean 0,55 and standard deviation (SD) 0,12. At a distance of 20 cm the autocorrelation mean was 0,4 with SD 0,16. Forest stand age, forest density and site had significant effects on lichen height in a model without interactions. Significant interactions between site and forest density, and forest stand age and forest density was observable. Results from a preliminary power analysis are showed in Table 1. Conclusions An effect of forest density was found, but varied between sites. Therefore general adjustments for this effect is difficult. Number of measure points is a trade-off between the needs of frequent detections of changes and trends (early warnings) and the effort spent on measuring. The longer time interval between measurements, the fewer points has to be measured for detecting changes. A solution might be to measure exactly the same spots at every occasion, although since autocorrelation disappears within short distance, the marking of the measured spots has to be reliable. Fig. 1. Autocorrelation pattern on the small scale in three different sites. The blue dots are autocorrelation values, the pink line is fitted to the values with lowess, blue lines are upper and lower confidence limits.