Download
1 / 19
220 likes | 367 Vues
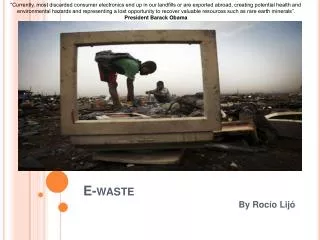
Inventorisation of E- Waste. Ashish Chaturvedi. Inventorisation of E- Waste. The scope of the inventory study should be defined in terms of geography and product categories. Geographical scope – City/Region/State or country where inventory needs to be done

E N D
Inventorisationof E-Waste Ashish Chaturvedi
Inventorisationof E-Waste The scope of the inventory study should be defined in terms of geography and product categories. Geographical scope – City/Region/State or country where inventory needs to be done Product Category Wise Scope - Computers (Desktops and Laptops), Printers, UPS, televisions, Refrigerators, DVD/VCD Players, Mobile Phones
Inventorisationof E-Waste Module 1 Module 2 Module 3
Assessment Method- Input andObsolescence The market size of WEEE generated can be estimated using the input method: • Input refers to the sales and imports of these products • The source of the sales data will include government statistics, secondary data available from Indian Market Research Bureau (IMRB), Industry Associations, etc. After collecting the sales data, calculate the average life / obsolescence rate of the products. Average life of a product can be divided into the following parts: • Primary usage life (first user) • Second use life
Detailed steps to be followed for the assessment (PC example) PC installed base & annual sales by segment Step 1 Step 2 Obsolescence rate by segment No. of computers entering the e-waste trade value chain Step 3 No. of computers scrapped (excluding those which enter the refurbishing/ re-use market) Step 4 Step 5 Estimate volume of scrap in MT
Assessment Steps Step 1 PC installed base & annual sales by segment How can you collect this information?
Assessment Method- Input andObsolescence Step 1 PC installed base & annual sales by segment All computing devices can be categorized broadly in: • Desktops • Laptops Installed base of desktops and notebooks over the last 10 years shall be obtained from IMRB - Integrated Technology andOperations (IMRB-ITOPS) Installed base and annual market size shall be broken-up into • Household • Businesses Further, the data shall be categorized by town-class
Assessment Steps Step 2 Obsolescence rate by segment How can you collect this information?
Assessment Steps Step 2 Obsolescence rate by segment ITOPS data: segment wise obsolescence rate (on the basis of town class, nature of business and SEC) • Sample Question: On an average, after how many years do you replace your old P.C. Primary Survey: questions on the use-life of devices will be asked to households and businesses Expert interviews: with players in the organized sectors on their experience of the use-life of devices
Assessment Steps Step 2 Obsolescence rate by segment Sample Grid
Assessment Steps Step 3 No. of computers entering the e-waste value chain How can you collect this information?
Assessment Steps Step 3 No. of computers entering the e-waste value chain Once the sales figures and obsolescence rate are available, we can calculate the number of Desktops and Notebooks which will enter the e-waste trade value chain using following calculation: N = I.B. x O.R. • N is the number of computers entering the e-waste cycle • I.B. is the Installed Base • O.R. is the Obsolescence Rate
Assessment Steps No. of computers scrapped (excluding those which enter the refurbishing/ re-use market) Step 4 How can you collect this information?
Assessment Steps No. of computers scrapped (excluding those which enter the refurbishing/ re-use market) Step 4 For estimating the ratio or percentage break-up of refurbished and scrapped, qualitative data can be collected from the following stakeholders: Scrap collectors Recyclers or e-waste processors Organized players in e-waste trade Based on the share suggested, the number of computers which are to be scrapped will be multiplied by the average weight of the computers which were sold in the nth year
Assessment Steps Step 5 Estimation of scrap volume The following information needs to be taken into account before doing the final estimation: Technological Advancements: • Reduction in weight • Change in composition of desktops and notebooks • Changes (increase or decrease) in the technical life Changes in the consumer behavior • Increase or decrease in the disposal rate
Validation Method- Tracking This method will verify the obsolescence rate and quantity estimates by tracking the movement of some components (trackers) of each product across the e-waste trade value chain. Example of trackers: • LCD in case of mobile phones • CRT in case of televisions • Motherboards & CRT in case of computers
Validation Method – Obsolescence Rate Verification Once the trackers are identified, qualitative study will be done across the various channel members involved in that e-waste processing For e.g. in case of TVs, random and repetitive visits will be made to CRT dismantlers and the movement of CRTs will be noted down; 5 to 6 areas of CRT collection shall be identified per city • 3-4 collectors or recyclers shall be identified in each area • Regular visits to these places shall be conducted to observe models and date of manufacturing over a period of time This will validate the calculated average life
Validation Method – QuantityEstimateVerification Interviews will be done with channel members (for the case of CRT) to find out the daily input of e-waste and the break-up of: • Total CRT accepted for dismantling per day • Percentage of CRT in working condition that are re-sold in market • CRT broken or dismantled • Final ratio of broken CRT and re-sold CRT Example: • Dismantled/re-sold ratio 50:50; 30 CRT dismantlers receive 100 CRTs daily • Therefore, the e-waste generated from televisions in Delhi would be approximately 1500 televisions/day This will validate the calculated average quantity of scrap