Download
1 / 47
470 likes | 786 Vues
Chapter 2 Economic Tools and Economic Thinking. making choices functions supply and demand empirical methods. With scarcity, must choose. making rational choices maximizing something given certain limits or constraints maximize well-being, profits, etc.

E N D
Chapter 2Economic Tools and Economic Thinking • making choices • functions • supply and demand • empirical methods
With scarcity, must choose • making rational choices • maximizing something • given certain limits or constraints • maximize well-being, profits, etc.
we assume people maximize their utility • (a measure of well being) • we assume firms maximize their profits • constraints: • income, prices, time
Choose X • to maximize V(X) • subject to constraints involving X and Z • X is endogenous variable • (choose X) • Z is exogenous variable • (Z is given)
example • choose # of children (X) • to maximize utility, V(X) • constrained by • earnings (Z1) • cost of children (Z2)
best choice of X =X* • X* depends on V(X), and Z
What affects choice of X? • how does choice of X change when Z changes? • comparative statics
example • how is # of children affected by • female earnings? • male earnings? • cost of education?
Using models • simplification of reality • better understand how something works • to use: • make assumptions • apply them to a framework • look at implications
if model is too simple • implications are not helpful • if model is too complicated • no implications • test the model • do the implications match real world data?
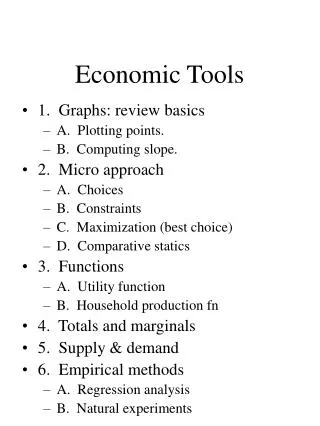
Functions • relationship between variables • utility function • production function
Utility function • U = U(X,Y) • utility depends on X and Y • X and Y are consumptions goods • X, Y are arguments of the function
more utility is better • so if U(choice 1) > U (choice 2) • always pick choice 1 • rational choice
If we observe people making choice 1, • then choice 1 must have higher utility • revealed preference
example 1 • if my U(married) > U(not married), then I get married OR • given I am married, then we conclude • U(married) > U(not married)
example 2 • we observe that most U.S. households contain > 1 person • so we conclude • U(living with people) > U(living alone)
Production function • amount of output depends on amount of inputs • labor • capital (machines, factories, etc)
household production • household good production depends on • time (T) • other inputs (Z) • G = G(T, Z)
example of household good • meals • inputs: -- food -- pots/pans -- appliances • time to make it
working with functions • interested in total of function • total production • total utility AND • interested in marginal changes • change in function value if one of arguments changes
marginal changes • how much does my utility change if eat one more oreo? • marginal utility of an oreo
dimishing marginal utility • marginal utility falls as I consume more and more • 1st oreo adds more utility than 10th oreo
how many more meals can I make if I get a microwave? • marginal product of a microwave
diminishing marginal returns • marginal product declines with more and more input • first microwave boosts my meal output more than 2nd or 3rd microwave • at some point I really have no need for additional microwaves
Supply and Demand • model behavior of buyers • Demand • model the behavior of sellers • Supply • buyers & sellers determine quantity & price
Market • haircuts in CNY per week • what factors affect buyer decisions? • price of haircuts • income • population • fashion • price of substitutes
what factors affect sellers decisions? • price of haircuts • costs of haircuts • profitability of alternative business
Assume: • first look at relationship between quantity and price • hold other factors constant • men and women do not differ in buying decision • men and women not viewed differently by sellers
Demand • relationship between • quantity of haircuts demanded (Qd) • price of haircuts • as price rises, Qd falls • holding other factors constant • Law of Demand
why does Qd fall when price rises? • substitution effect • substitute less expensive goods • income effect • higher prices leave you feeling poorer
Demand schedule P Qd $30 15,000 $20 20,000 $10 25,000
P $30 $20 $10 D Q haircuts 15K 20K 25K
Supply • relationship between • quantity of haircuts supplied • price of haircuts • as price rises, Qs rises • holding other factors constant • Law of Supply
Supply schedule P Qs $30 25,000 $20 20,000 $10 15,000
P $30 $20 $10 S Q haircuts 15K 20K 25K
the market • supply and demand together • graph each schedule
P $30 $20 $10 D S Q haircuts 15K 20K 25K P = $20 Q = 20K
equilibrium • P=$20, Q=20,000 • Qs = Qd • with other factors constant, P & Q will stay at this point
Allow factors to change • CNY population increases • more people, • more haircuts demanded at every price • increase in demand
P $20 D’ D S Q haircuts 20K D increases: P increases Q increases
Allow factors to change • NY increases fee for cosmetology license • more costly to provide haircuts • fewer haircuts supplied • decrease in supply
P $20 S’ D S Q haircuts 20K S decreases: P increases Q decreases
Men vs. women & haircuts • assume sellers view women’s haircuts as more costly • at any price, sellers willing to provide fewer haircuts for women than for men • Women’s supply curve to the left of men’s supply curve
P S women D S men Q haircuts Women’s haircuts have a higher price
assume women are less price sensitive to haircuts than men • price increase causes small decrease in Qd • women’s demand for haircuts is less elastic than men’s • women’s demand curve is steeper than men’s
P D men S D women Q haircuts Women’s haircuts have a higher price
is this discrimination? • some laws forbid different prices for men vs. women • haircuts • drycleaning • is this fair? • is this efficient?