Download
1 / 16
160 likes | 327 Vues
Optimizing Resources for Restoring Acid Mine Drainage Impaired Watersheds in WV (Part 2). J. Todd Petty, Richard Herd, Paul Ziemkiewicz, Jen Fulton, Brady Gutta, Mike Strager and Julie Svetlik West Virginia Water Research Institute National Mine Land Reclamation Center

E N D
Optimizing Resources for Restoring Acid Mine Drainage Impaired Watersheds in WV(Part 2) J. Todd Petty, Richard Herd, Paul Ziemkiewicz, Jen Fulton, Brady Gutta, Mike Strager and Julie Svetlik West Virginia Water Research Institute National Mine Land Reclamation Center Watershed Assistance Center Division of Forestry West Virginia University
Relevant Spatial Scales 8 digit 12 digit Site Scale Segment Scale 10 digit
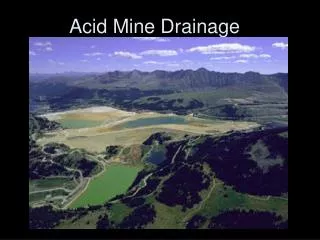
Extent of Mining Impact in the upper Monongahela River Basin
Three Fork of Tygart Valley River • Monongahela River • Drainage area = 267 km2 • 80 AMLs mapped • 73 km impaired • 32 sampling sites
EcoUnit Concept • = a measure of the functional significance of a measurable unit of stream (length or surface area). • EU = Functional Weight x Stream Segment Length (km) • calculated for all stream segments within a defined area • scalable from stream segment to whole watershed • decision making “currency” • Examples: • Brook Trout Reproductive Habitat EcoUnit = stream length (m) weighted by its potential value as habitat for brook trout spawning and juvenile recruitment (Petty and Thorne 2005; Jeffers et al. 2008). • Warmwater Fishery EcoUnit = stream surface area (km2) weighted by its potential value as habitat for smallmouth bass (Merovich and Petty 2007). • Invertebrate Diversity EcoUnit = stream surface area (km2) weighted by its potential to support diverse macroinvertebrate assemblages (Merovich and Petty 2007). • Organic Matter Processing EcoUnit = stream length (m) weighted by its potential value in converting coarse particulate organic matter to biomass.
EU Weighting Functions Ecological Condition and Potential Restoration Potential
EcoUnit Calculation HEU = SL x EP = Historic EUs CEU = SL x EP x EC = Current EUs LEU = HEU – CEU = LostEUs *REU = LEU x ER = RestorableEUs FEU = CEU + REU = FutureEUs SL = segment length EP = ecological potential weight EC = ecological condition weight ER = ecological restorability weight
Estimates of Current EUs (diversity) • HEUs = 386 km • HEUs = 259 km • LEUs = 126 km • REUs – dependent on specific remediation technologies and placement
Restoration Alternatives Alternative 1 – In-stream dosers in the North and South Forks of Birds Creek, and in-stream dosers in Squires Run and Racoon Run. Alternative 2 – Same as alternative 1 with the addition of at-source passive treatment in Brains Creek. Alternative 3 – Same as alternative 1 with the exception of utilizing one doser in the mainstem of Birds Creek rather than one each in the North and South Forks.
Future Expected Conditions (diversity) Current = 259 EUs Alt 2 = 294 EUs Alt 3= 283 EUs
Restoration Benefits Restoration Costs
Net Present Value of Restoration NPV = (total benefit – total cost) x annual discounting factor. Fishery benefits = $28,000 / fishery mile (from USFWS 2006). Benefits (from restored fishery miles) begin accruing in year 3. Parentheses indicate a net cost to restoration.
Conclusions Our strategic process provides an objective means for making decisions about how best to invest restoration dollars into AMD impacted watersheds in WV. Full, at-source cleanup of AMD sources in this watershed was projected to cost over $10 M. We were able to show that a more strategic approach to restoration could produce a 92% recovery in fishery units at less than half the original cost ($4.1 M). We also were able to show that a more strategic approach could produce a positive NPV over a 20 year period (>$650,000).
Conclusions • We believe that our decision making process is applicable throughout the eastern coal mining region where AMD from pre-law mining has severely impacted streams and their resident fish populations. • The process should enable stakeholders to maximize ecological benefits while minimizing the overall costs of restoration in one particular area. • Ultimately, this should facilitate the efficient recovery of fisheries resources in mining impaired watersheds throughout the eastern US.