Evaluating Visual Interfaces for Digital Government using Fisheye Technology
This project presents an innovative approach to evaluating visual interfaces for digital government systems through the use of Fisheye technology. Led by Peter Sommer, Ju-Ling Shih, and Laura Zadoff, we detail the methodology, including expert interviews, user needs analysis, and usability testing. Our goal is to optimize interface effectiveness, identify usability issues, and ensure the design meets the evolving needs of users. The evaluation process examines past and ongoing projects, aiming to enhance user experience with data accessibility and navigation.

Evaluating Visual Interfaces for Digital Government using Fisheye Technology
E N D
Presentation Transcript
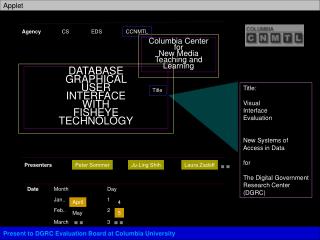
Applet CS EDS CCNMTL Agency Columbia Center for New Media Teaching and Learning DATABASE GRAPHICAL USER INTERFACE WITH FISHEYE TECHNOLOGY Title: Visual Interface Evaluation New Systems of Access in Data for The Digital Government Research Center (DGRC) Title Presenters Peter Sommer Ju-Ling Shih Laura Zadoff Date Month Day Jan.. 1 April 4 Feb.. 2 May 5 March 3 Present to DGRC Evaluation Board at Columbia University
Methodology Flowchart - Past Timeline Stage One Fall 1999 Start of DGRC Project (Link) First DGRC Interface: Original Interface (Link) Fall 2001 Evaluation Started Development of Evaluation Plan (Link) Second DGRC Interface: Fisheye Interface (Link) Responses To Fisheye Interface(Link) Analysis of DataGate Interface (Link) • Interview of Experts (Link) • Define Users • User Needs, Behaviors, Preferences, Reactions
Methodology Flowchart - Present Timeline Stage Two Formative-Illuminative Evaluation (Link) Spring 2002 • Resource Analysis on Census Data (Link) • Interview Experts for Census Data Analysis • Fisheye Interface Research • Innovative Designs with Fisheye Applications • Componential Analysis on Fisheye Features • (Link) Census Characteristics and Interface Possibilities (Link) Refine Heuristics for GUI Present In Progress User and Environment Profiles Design User and Task Analysis
Methodology Flowchart - Future Timeline Stage Three Fall 2002 Development of Future Plans (Link) • Perform User and Task Analysis • Think Aloud • Interview with Heuristics Prototype Testing Usability Testing Summative Evaluation With Questionnaire
About the Project • Project Description • Video Clip • Project Description (Judith Klavans) • Rationale for Evaluation (Judith Klavans) • Project Presentation • Video Clip • Project Presentation (Surabhan Temiyabutr) • Screen Shot • Old DGUI • New DGUI • Gummy Bear Show • Websites • DGUI • Old Gummy Bear Show • Colorful Gummy Bear Show
Development of Evaluation Plan • Goals of Evaluation • optimize the effectiveness of the interface, • identify usability problems, • provide feedbackon the overall functionality, • anticipate changes in user need that might drive future development, • validate the design, • indicate the extent to which the interface improves on previous interfaces. • Methods • Heuristics • User and Task Analysis
Heuristics for Database Interface Usability inspection method targeting interface design by judging compliances to principles for successful design. • Design • Adapted from existing research on interface design • Modified for Database • Heuristic categories • Appearance, Language, Functionality, Structure, Assistance • Evaluators • Library Staff
User and Task Analysis • Process • Task Scenarios • Observation • Interview • Goal • User Behaviors • User Intuitiveness for Different Groups of Users • Strengths and Weaknesses of the Design • Participants • Content Experts • Government Agency Workers • Faculty and Students
Responses To Fisheye Interface • Interviewees: • EDS librarians • Jane Weintrop • Nicole Fox • Reference Desk librarians • Jerry Breeze • Alysse Jordan
Analysis of DataGate Interface • Purpose • Understand User Behaviors with Database • Query Log Analysis of EDS DataGate by Nicole Fox • Flexibility in Choosing Variables • Options to Sets of Variables • Options to Adjust Individual Variable • Keyword Search: Search Methods and Syntax • “All” vs. “Any” • “And” vs. “Or” • Modification of Queries • From General to Specific • From Specific to General
Interview Findings User Type Identification User Goals Kinds of Questions Brief History of Search Types of Searches Related Terms for Searches Selecting the database Learning to Use the Interface Students’ Searching Styles Searching Styles of Fisheye Design Flexibility to Searching Styles Helping the User Define the Search Standardize Problem Librarians’ Duty Suggestions for the Fisheye Design
Interview Findings • User Type Identification • Novice and Power/Expert Users • Related Terms for Searches • Difficulty of Use of Alternative Terms • Learning to Use the Interface • Innovative Interface • Need Orientation and Time to Familiarize with the Interface • Helping the User Define the Search • Help users to Visualize the Context and Structure of Information • Definition and Redefinition of Search [These issues need to be considered in all rich databases. All these issues were shared with the team and considered in the further development of our heuristics.]
Formative-Illuminative Evaluation • Playing Formative Role with Illuminative Goals • Inform Design Decisions • Change from Energy to Census data Anchoring the Focus on Census would allow: • Contribution to Census • Testing the Interface with Existing Datasets: • Data is rich and accessible • There is enough of a user knowledge base to test • Findings are Transferable to Energy, Labor, or other Census data.
Resource Analysis on Census Data • Census Data Characteristics • User (Link) • Variables (Link) • Presentation Forms (Link) • Geographical References (Link)
Users • Why define users? • To Create Task Scenario for User and Task Analysis • How? • Interview Experts • Regarding characteristics of PUMS: • Identify Target Users that • Do not require to identify specific small geographic areas • Have knowledge, access, and time to program and process the samples • Define Purposes and Tasks that involve • Cross-Variables Research • Study Relationships among variables not shown in existing tabulations • Concentrate on the characteristics of specifically defined populations
User Types Groups Expertise
Variables • Information Organization • Hierarchical Structure • Massive Amount • Terminology • Some Variable Definitions Have Changed from Census to Census • Terminology is Not Always Obvious. • For example, there is no one variable for ethnicity. Asian ethnicity is coded in the detailed race variable, Hispanic ethnicity in the detailed Hispanic origin field, and European ethnicity in the ancestry variable. • Different Census Questions Performed in Different Years
Presentation Forms • Using Geographic Information Systems (GIS) • Using Dynamic Query Maps • Dynamic Queries: http://www.cs.umd.edu/hcil/eosdis • Applicable to All Types of Data
Geographical References • Geographic Boundaries Change Over Time. • i.e. Zip codes, definition of blocks • Geographic Areas Are Unique to Census • i.e. Tracts, Blocks and Block Groups. • PUMS 5%: Only 100,000 people are included. • Geographic Areas Are Identified by Codes. • The Same Common Names May Be Used for Different Geographic Areas. • i.e. New York is a state, metropolitan area, and county.
Fisheye Interface Research Fisheye Applications • Purposes • Searching Innovative Designs Using Fisheye Features for Reference • Explore the Use of the Fisheye Features for Usability Analysis • Emend Heuristics for Database Interface Using Fisheye Features • Features • Seeing Full Context while Focusing on Selected Items • Content Visualization (Link) • Dynamic Menu (Link) • Zoom In, Zoom Out (Link) • Searchlight (Link)
Content Visualization • Information Retrieval While Seeing the Full Content • PhotoFinder Project: http://www.cs.umd.edu/hcil/photolib/ • A Hierarchical Focus+Context Method for Image Browsing http://www.viktoria.informatik.gu.se/groups/play/demos/hierarchical/
Dynamic Menu • Demonstration of How the Interface Can Compromise Oversized Categories. • Magnification on Items with Visual Display of Full Content • Fisheye Menu: http://www.cs.umd.edu/hcil/fisheyemenu/ • Sony Music 100 Years Soundtrack for A Century http://millennium.sonymusic.com/ • Visualization Menu: Jazz http://www.cs.umd.edu/hcil/jazz/
Zoom In, Zoom Out • Being Able to Manipulate the Level of Magnification • The SmartMoney Map of the Market http://www.smartmoney.com/marketmap/ • The Zoom Browser Applet http://www.viktoria.informatik.gu.se/groups/play/demos/zoombrowser/applet/
Searchlight • Present Definition of the Selected Items • Provide Synonyms • Show Relationships Between Terms • Example • Race =\= ethnic origin = ancestry =\= place of birth • educational attainment =\= highest education allocation • PUMA (above 100,000) = state =\= county =\= groups of counties • Show Number of Possible Results • Notes on the limitations of data. Make the users aware of the small area data modification due to the confidentiality protection. • Display Cross-References Among Different Databases
Census Characteristics and Interface Possibilities Variables Hierarchical Structure Massive Amount Terminology Definitions Change Obscure Terminology Census Question Change Geographical References Boundaries Change Unique Boundaries Codes for Areas Various Meanings for Same Names Content Visualization Display Information Organization Dynamic Menu Magnification on Selected Items with Full Content Zoom In, Zoom Out Manipulate the Level of Magnification Searchlight Multiple Layers of Display Alternative Terms Definition of Terms Alternative Pathways Create Dynamic Maps
Planning • User and Task Analysis • Task Scenarios for Different User Groups • Prototype Testing. • Testing with Heuristics • Evaluate with Individual Features • How effective is it? Are the results transferable to the usability of its totality? • Define Minimum Functions in the Stage of Development • What are the basic criteria? How complete should the prototype be in order to get meaningful results in functionality? • Usability Testing • Questionnaire
Discussion • We would like to invite discussion on experience in conducting formative evaluation, which provides proper feedback to the design team when the design is at its prototype stage.