Download
1 / 23
230 likes | 365 Vues
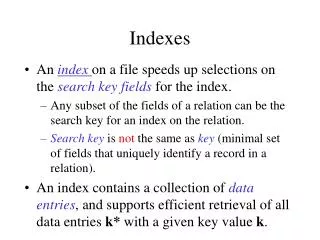
Selected Investment Indexes. Chapter 11. Background. Chapter investigates domestic and international indexes for stock and bond markets Objectives include using indexes to Rapidly gain knowledge Confront theories with facts Investigate market inter-relationships Allocate assets

E N D
Selected Investment Indexes Chapter 11 Chapter 11: Selected Investment Indexes
Background • Chapter investigates domestic and international indexes for stock and bond markets • Objectives include using indexes to • Rapidly gain knowledge • Confront theories with facts • Investigate market inter-relationships • Allocate assets • Examine overall economic relationships Chapter 11: Selected Investment Indexes
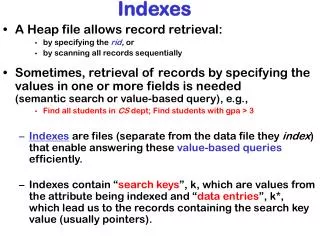
Long-Term Returns for Major Asset Classes • We’ll examine seven U.S. price indexes: • Large company stocks (S&P500) • Long-term U.S. government bonds • Intermediate-term U.S. government bonds • U.S. Treasury bills • Small company stocks • Long-term corporate bonds • Inflation (percentage change in CPI)
Long-Term Returns for Major Asset Classes • Examine indexes because individual security prices reflect non-systematic events, whereas price indexes contain many different securities—a diversified portfolio • Allows examination of meaningful trends and relationship between categories of investments Chapter 11: Selected Investment Indexes
Ibbotson’s Seven Basic Indexes • Large company stock index • Measured by S&P500 Stocks Composite Index, using total returns • Annual compound growth of 11.3% from 1925-1999 • Dividends represent 4.5% and capital gains 6.6% • Annual returns fluctuated from a low of –43.3% (in 1933) to a high of 54.0% (in 1934) Chapter 11: Selected Investment Indexes
Ibbotson’s Seven Basic Indexes • Small company stock index • Annual compound growth of 12.6% from 1925 to 1999 • Range from low of –58.0% (in 1937) to 142.9% (in 1933) • The small stocks index shows that investors were rewarded with a high total return as compensation for the unique risk involved with small stock investing Chapter 11: Selected Investment Indexes
Ibbotson’s Seven Basic Indexes • Long-term corporate bond index • Annual compound growth rate of 5.6% • Range of –8.1% (in 1969) to 42.6% (in 1982) Chapter 11: Selected Investment Indexes
Ibbotson’s Seven Basic Indexes • Long-term government bond index • Annual compound growth rate of 5.1% • Range from –9.2% (in 1967) to 40.4% (in 1982) • Interestingly, the coupon income component of the Treasury bond’s total return is > 100%, as the price declines exceeded the price increases Chapter 11: Selected Investment Indexes
Ibbotson’s Seven Basic Indexes • Intermediate-term government bond index: • Annual compound growth rate of 5.2% • Range from –5.1% (in 1994) to 29.1% (in 1982) • Return from income was 4.7% of the 5.2% total return Chapter 11: Selected Investment Indexes
Ibbotson’s Seven Basic Indexes • U.S. Treasury Bill index: • Annual compound growth rate of 3.8% • Range from 0% (in 1938-1940) to 14.7% (in 1981) • Over the 74-year sample period, T-bill returns exceeded inflation rate by 0.6% (or 60 basis points) Chapter 11: Selected Investment Indexes
Ibbotson’s Seven Basic Indexes • Inflation in the U.S. • Compound annual inflation rate of 3.1% • Range from –10.3% (in 1932) to 18.2% (in 1946) • Deflation occurred during the Depression from 1926-1933 Chapter 11: Selected Investment Indexes
Asset Class Annual Return Ending Wealth S&P 500 11.3% $2,845.63 Small company stock index 12.6% $6,640.79 Long-term corporate bond index 5.6% $56.38 Long-term government bond index 5.1% $40.22 Intermediate-term govt. bond index 5.2% $43.93 U.S. Treasury Bills 3.8% $15.64 Inflation 3.1% $9.39 Wealth Accumulation • If you had invested $1 in the following from end of 1925 to end of 1999 it would have increased to • Method of computation is (1 + return)n = Ending Wealth
Wealth Accumulation • Inflation means that the purchasing power of $1 is not the same from year-to-year (it decreases) • $1 of purchases made in 1925 would cost $9.39 by 1999 • $1 x (1 + 0.030728)74 = $9.39 • Therefore, the $2,845.63 after adjusting for inflation is only worth ? in real terms • $2,845.63 $9.39 = $303.05 (or 1.113469 1.030728) • While the accumulated real wealth is much lower than the nominal wealth, it is still an impressive number Chapter 11: Selected Investment Indexes
Risk Premium Type Definition Arithmetic Mean Risk Premium Small company premium Small Cap Return – Large Cap Return 17.6% - 13.3% = 4.3% Equity premium Large Stock Return – T-Bill Return 13.3% - 3.8% = 9.5% Horizon (Time) premium T-Bond Return – T-Bill Return 5.9% - 3.8% = 2.1% Inflation premium T-Bill Return – Inflation Rate 3.8% - 3.2% = 0.6% Risk and Return • Risk premiums represent the additional return expected by investors when they select a certain class of asset; equities compared to bonds, for instance
Reinvestment Return • Bonds that pay a coupon have 3 different types of income • From cash flows • From capital appreciation (or depreciation) • From reinvestment • When calculating returns over multiple time periods, it is conventionally assumed that cash flows are reinvested as soon as received (reinvestment income) • Can represent a sizable portion of return, especially for bonds Chapter 11: Selected Investment Indexes
October 19, 1987 • On October 19, 1987 the international stock market crashed, suffering a 22.6% loss in the DJIA • However, the stock market index ended the 1980s with an overall gain • Therefore, large short-run price fluctuations may not be that important in the long-run Chapter 11: Selected Investment Indexes
Serial Correlation • Serial correlation (or autocorrelation) • Measures the extent to which the values in one series are related to leading or lagged values in the same time series of data • Positive serial correlation occurs when data moves in trends • Negative serial correlation occurs when data experiences reversals • Random numbers have a zero serial correlation Chapter 11: Selected Investment Indexes
Serial Correlation • Observations • Inflation moves in trends as do Treasury bills • The absence of serial correlation in the stock and long-term bond indexes suggests that these returns tend to fluctuate in a random fashion, making them difficult to forecast • Technicians disagree with this finding and claim they can discern useful patterns
Real Returns • Real returns represent nominal returns less the inflation premium
Ibbotson: Problem 11-3 • $1,000 invested for 10 years at 17.8% • Inflation averaged 3.2% for 10 years • Nominal portfolio value: • $1,000(1.178)10 = $5,145.80 • Real portfolio value: • $5,145.80/(1.032)10 = $3,755.40
Ibbotson: Problem 11-6 • $40,000 saved in eight years • Inflation expected at 4% per year • Inflation-adjusted value: • $40,000/(1.04)8 = $29,227