Download
1 / 17
170 likes | 280 Vues
Trends in Shallow Ground-Water Quality of the Delmarva Peninsula Results from regional and local studies. Linda M. Debrewer Judith M. Denver. U.S. Department of the Interior U.S. Geological Survey. Regional Network Design. Sampled in 2001 Agricultural Land Use (agLUS) 29 regional wells

E N D
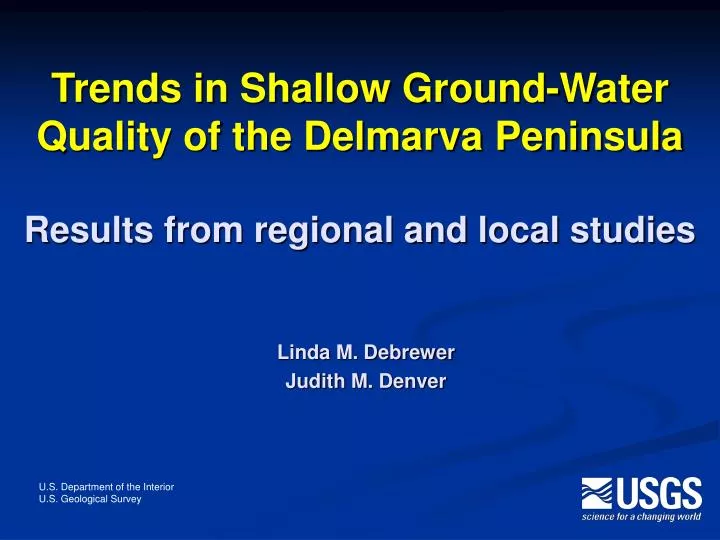
Trends in Shallow Ground-Water Quality of the Delmarva Peninsula Results from regional and local studies Linda M. Debrewer Judith M. Denver U.S. Department of the Interior U.S. Geological Survey
Regional Network Design Sampled in 2001 Agricultural Land Use (agLUS) • 29 regional wells • Median depth 22 feet • 16 trend wells (1988 and 2001) Major Aquifer Survey (MAS) • 29 domestic wells • Median depth 45 feet • 23 trends wells (1988 and 2001)
Local Flow-System Studies Locust Grove • Well-drained upland • Oxic conditions in surficial aquifer • Anoxic discharge from deeper aquifer Fairmount • Well-drained upland • Thick sandy surficial aquifer • Oxic conditions throughout Willards • Complex sedimentation • Variable redox conditions
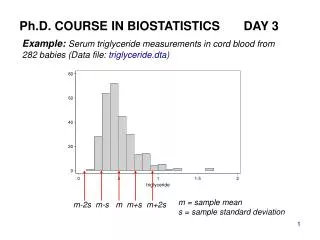
Delmarva Peninsula Natural Water Chemistry Controlled by: • Rainfall and mineral dissolution • Redox reactions • Residence time in flow system • Saline intrusion near coasts Generally dilute, acidic, low nitrate Generally found beneath forested areas Aquifer Sediments Quartz sand, clay, silt, gravel, with some shell Organic matter in swamps and wetlands Unconfined surficial aquifer • Covers 90% of study area • Highly permeable • Ranges from 20 feet to over 100 feet in thickness Water table: 0 to 30 feet below land surface
Spatial Trends in Nitrate Elevated concentrations throughout Delmarva • Above background in 68 percent of wells in both networks • Above MCL in about 33 percent of wells from both networks Median concentrations similar at all depths • 5.4 mg/L, agLUS (median 22 feet) • 5.5 mg/L, MAS (median 45 feet) • 5.2 mg/L, public supply wells (median 85 feet)
Spatial Trends in Nitrate Nitrate significantly higher in: • Oxygen-rich areas throughout surficial aquifer • Well-drained areas in shallow network Positively correlated with percent agricultural land use
Difference in Nitrate, in milligrams per liter Temporal Trends in Nitrate Increase of 2 mg/L in deeper, older samples in oxygen-rich areas from 1988 to 2001
2001 Recharge 1988 Recharge Recharge date estimated from SF6 method Nitrogen Fertilizer Use
Locust Grove Flow System • Sandy well-drained sediments • Lower nitrate at depth: historical use and anoxic discharge from confined • Higher nitrate moved farther into system over time • Median unchanged (~10 mg/L)
Fairmount Flow System • Thick, sandy aquifer and oxic conditions throughout • Nitrate affected by application of chicken manure • Lower nitrate in shallow water beneath forested areas • Higher nitrate at depth in upgradient agricultural land use
Willards Flow System • Complex local flow system in shallow aquifer; regional flow in deeper aquifer • Nitrate generally below detection level • Higher nitrate in areas with sandy sediments • Anoxic conditions and no evidence of human impact in deeper aquifer 0.1 <0.1 10 <0.1 <0.1 <0.1 11
Spatial Trends in Pesticides Regional Networks • Pesticides and degradates detected in 93 percent of agLUS and 83 percent of MAS • Widespread detection reflects abundant use, chemical properties, and aquifer characteristics • Metolachlor, alachlor, and atrazine most commonly used and detected
Spatial Trends in Pesticides • Degradates detected more frequently and at higher concentrations than parent compounds • Pesticides higher in well-drained soils in the shallow agricultural wells and in oxygen-rich environments throughout aquifer
Temporal Trends in Pesticides 1988 to 2001 Higher detection frequencies in 2001 due to better analytical methods and lower reporting limits rather than increases in pesticide concentrations Atrazine and metolachlor were the only compounds detected in both 1988 and 2001 in the same wells
Trends in Pesticides Local-Scale Studies • Occurrence similar in local-scale studies and regional studies • Atrazine and metolachlor or their degradates persist at low levels in water as old as 30 years in well-drained settings • Pesticides are not detected or present at very low levels even in shallow sediments in the poorly drained, organic-rich setting • Generally little evidence of degradation as water travels along flow paths
Issues Related to Study Scale Regional-scale studies • Design has minimal control to limit factors affecting water quality • Generalized results require use of statistics to distinguish between trends and noise in data • Determine overall occurrence and distribution of compounds Local-scale studies • More control over factors affecting water quality • Results used to help understand regional statistical analyses
Issues Related to Study of Long Term Trends • Maintaining consistent network of sampling sites • Changing lab methods, reporting levels, and analytical schedules • Age-dating useful in flow-system studies to track changes in water chemistry over time; less useful on regional scales with mixed land uses