Download
1 / 11
110 likes | 210 Vues
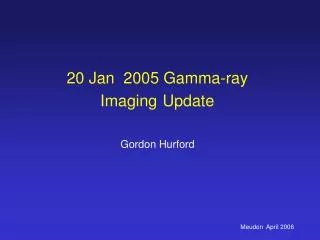
20 Jan 2005 Gamma-ray Imaging Update. Gordon Hurford. Meudon April 2006. 250 – 500 keV 2215-2231 keV 3500-7000 keV. 20 January 2005 06:44 - 06:56. 128 x 128 arcsec. 250-500 keV 250 – 500 keV 2215-2231keV

E N D
20 Jan 2005 Gamma-ray ImagingUpdate Gordon Hurford Meudon April 2006
250 – 500 keV 2215-2231 keV 3500-7000 keV
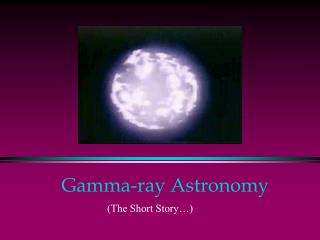
20 January 2005 06:44 - 06:56 128 x 128 arcsec 250-500 keV 250 – 500 keV 2215-2231keV RMC 4-9 RMC 6+9 RMC6+9 12 arcsec 35 arcsec 35 arcsec 35 arcsecond resolution cannot distinguish the footpoints
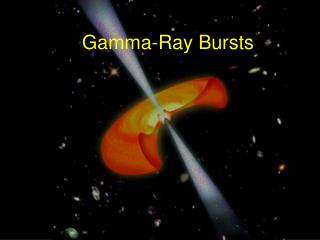
20 January 2005 06:44-06:56 TRACE 1600A at 06:52:30 UT 250 – 500 keV 30, 50, 70, 90% contours 2215-2231 keV centroid 1- error circle
Imaging to Spectroscopy Comparison • Imaged / Spectral NC count ratios are consistent with 1 • NC line counts are from a compact source • Ions are flare-accelerated
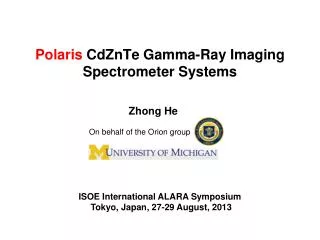
20 Jan 2005 Gamma Continuum Imaging 3500 -7000 keV 2215 -2231 keV 1500 -2100 keV 1000 -1500 keV 550 -1000 keV 250 –500 keV
Status of 511 keV line Imaging 20 January 2005 06:44 – 07:00 • Imaging in the 500-520 keV band is yielding weak detections with 9R and 9F. • No detections with other RMCs • 9F imaged flux is consistently higher than 9R • At least 50% of imaged 500-520 keV flux is from continuum • Continuum imaged flux is consistently higher in 9F than 9R Off-diagonal response is important. No useful positron annihilation line imaging yet.