1. Neutrino Oscillation
820 likes | 2.61k Vues
1. Neutrino Oscillation. θ 13. θ 23. θ 23. θ 12. 1. 2. 3. θ 12. θ 13. 1. Neutrino Oscillation. Gaol of RENO experiment = θ 13. ν e. ν e. ν e. ν e. ν e. 1. Neutrino Oscillation. Probability ν e. disappearance. Distance. γ. P rompt signal Σ E ~ 1.022MeV. γ. γ. P.

1. Neutrino Oscillation
E N D
Presentation Transcript
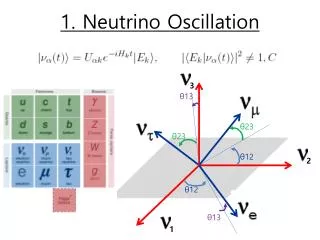
1. Neutrino Oscillation θ13 θ23 θ23 θ12 1 2 3 θ12 θ13
1. Neutrino Oscillation Gaol of RENO experiment = θ13
νe νe νe νe νe 1. Neutrino Oscillation Probabilityνe disappearance Distance
γ Prompt signal ΣE ~ 1.022MeV γ γ P 2. Neutrino Detecting Neutron captured byGadolinium ~30μs n Gd γ γ Delayed signal ΣE ~ 7.96MeV γ
2. Neutrino Detecting 6 MeV 1 MeV 8 MeV 10 MeV From Bemporad, Gratta and Vogel Arbitrary Cross Section Flux ▶ Expected measurable neutriron spectrum ▶ Prompt signal ▶ Delayed signal
2. Detector & Data taking Radioactive Source diving • #354 10” ID PMTs : 14% surface coverage • #67 10” OD PMTs • Both PMTs : HAMAMATSU, R7081
2. Detector & Data taking HV supply H V Decoupler Qbee(DAQ) Signal out Signal transform to Digital Online PC Offline PC Reduction Selecting neutrino event Raw Data Ch Time Signal size PRD Selecting interesting information Calibration analysis binary NPE table ntuple form RFM ;root file (reformat)
3. Calibration Detector Deposit Energy Qbee PMT Unknowing Energ[MeV] photoelectron current ADC count f(x)’’ f(x)’ f(x) Calibration 3 step QBEE calibration Gain matching Energy calibration E
3. Calibration • ▶ QBEE Calibration • imagineinput charge(current) → output count : count pC(current) f(x)
3. Calibration P M T Photocathode : Alkali (1group) 2.xxeV work function dynodes 2 E=hc/λ~1240eV·nm/400nm ~3eV current Nel 1 3 n electron multiplication Ne=GainⅹNp.e • ▶ Gain variation • → regular checking
3. Calibration • ▶ Gain matching • Single Photo-electron measurement
3. Calibration • ▶ Gain matching f(x)’ pCp.e <Coverage ~ 12.6%> 137Cs is satisfied with (354 PMT > p.e) condition
3. Calibration • ▶ Gain matching f(x)’ pCp.e
3. Calibration • ▶ radio active souce for Energy calibration 60Co 137Cs 2.506 MeV 0.662 MeV Far Near
3. Calibration • ▶ radio active souce for Energy calibration 68Ge 1.022 MeV
3. Calibration • ▶ radio active souce for Energy calibration • Sources @ center. • Near/Far show similar spectra. p(n,g) neutroncapture signal Gd(n,g) neutroncapture signal 2.2 MeV 7.96 MeV Far Near
3. Calibration • ▶ Energy calibration f(x)’’ p.e MeV • PE to MeV Function(p2*X2+p1*X+p1)
3. Calibration • ▶ Detector stability • Change p.e/MeV
4. MC simulation ▶ RENO MC simulation : based on GLG4SIM geant 4 program. derived from KLG4SIM of KamLAND collaboration.
4. MC simulation MC_single PMT p.e distribution Real_data_single PMT p.e distribution
4. MC simulation • ▶ Upgrading MC
4. MC simulation • ▶ Cs-137 MC
4. MC simulation • ▶ Ge-68 MC
4. MC simulation Ge-68 : 3.2% Cs-137 : 1.7% ▶ Reduced Energy Co-60 : 1.6%
5. Results • ▶ Improvement tuning Cs-137 Ge-68 Co-60
5. Results • ▶ Improvement Energy calibration
5. Results • ▶ Improvement Energy calibration
summary • ▶ To get energy information, • we have to do calibration process • 1. Qbeecalibraiton • 2. Gain matching • 3. Energy calibration • ▶ Upgrading MC for radioactive source data • Application for capslue & container
Pth : Reactor Thermal power f : Fission fraction of each isotope (reactor core simulation of Westinghouse ANC, and has error U235: 3.3%, Pu239: 4%, U238: 6.5%, Pu241:11%) ϕ : Interacted Neutrino Spectrum of each fission isotope E : Energy released per fission
From Bemporad, Gratta and Vogel Arbitrary Cross Section Flux Expected measurable neutriron spectrum • The observable antineutrino spectrum is the product of the flux and the cross section The most probable neutrino energy interacting at a detector is 3.8 MeV The cut-off at 1.8 MeV is due to the minimum neutrino energy required for IBD event.
6 MeV 1 MeV 10 MeV 8 MeV Expected S1 & S2 spectrum (1 MeV 2γ’s) + (e+ kinetic energy), E = 1~10 MeV epe+ + n(prompt) + p D + (2.2 MeV) (delayed) • + GdGd* Gd+ ’s(8 MeV) (delayed) • n+p→D+ γ(2.2MeV), n+Gd→Gd+γ’s(8MeV)
Radioactive Sources 137Cs It happens that in the beta decay of 137Cs, the product barium nucleus is left in an "excited" state. This decays in a few minutes back to the "ground" state of the barium nucleus, emitting a photon of fairly high energy, which is a "gamma" rays of energy 0.66 MeV.
Radioactive Sources 60Co Multiple Gamma =2.506 MeV
Radioactive Sources 68Ge Germanium-68 decays by pure electron capture (EC) to the ground state of 68Ga with a half-life of 270.95(16) d. Gallium-68 in turn decays with a half- life of 67.71(9) min by a combination of EC and positron emission primarily to the ground state of 68Zn. stopped positron signal using 68Ge source→positron threshold
Radioactive Sources 252Cf When a 252Cf nucleus spontaneously fssions, it emits on average 4 neutrons and approximately 20 low energy gamma rays. These ssion neutrons are used to calibrate the neutron detection efficiency.
Cs137 Co60 Label 6.35mm Epoxy Holder 4.445mm 0.508mm Radioactive materials <단면> 25.4mm Holder : Poly(methyl methacrylate) 밀도 1.18g/cm3 Cover : Epoxy 라고만 나옴 : Cs137 과 Co60 은 같은 모양입니다.
Ge68 Disk 총 두께 ~ 0.76mm 지름 =23.8mm 3mm Source : 밀도 9 mg/cm2 , 두께 0.254mm 의 aluminumized Mylar(polyester) disk에 3mm 지름으로 deposit 됨 Cover : 1. 밀도 0.9 mg/cm2, 두께(안나옴) 대략 0.25mm 의 polyimide Film(Kapton) 2. 밀도, 두께 안나옴Decal(film종류) // film개념이라 두께에 대한 정보가 없는듯함 사진에 흰색 Label지가 Decal같음 Retaing Ring : 제질 안나옴 Aluminum Holder : aluminum ~알루미늄 hodler얇은 부분 0.4mm
원 근거리 소스 아크릴 원통 호의 길이 20mm 7mm 8mm(뚜껑두께) 4mm 2mm 40mm 20mm 8mm 3mm(밑 부분 두께) 3mm(두께) 20mm 정육각형 8mm(뚜껑두께) 3mm 뚜껑 위면 4mm 뚜껑 단면
Convolutions Imagine that we try to measure a delta function in some way … Despite the fact that the true signal is a spike, our measuring system will always render a signal that is ‘instrumentally limited’ by something often called the ‘resolution function’. Detected signal True signal If the resolution function g(t) is similar to the true signal f(t), the output function c(t) can effectively mask the true signal. Resolution function Convolved signal True signal http://www.jhu.edu/~signals/convolve/index.html
3. Calibration P M T Photocathode : Alkali (1group) 2.xxeV work function dynodes 2 E=hc/λ~1240eV·nm/400nm ~3eV current Nel 1 3 n electron multiplication Ne=GainⅹNp.e