
p < 0,01
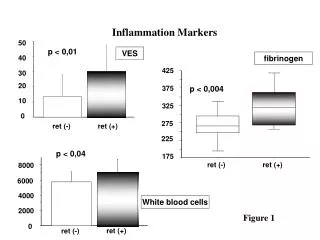
Inflammation Markers. 50. p < 0,01. VES. 40. fibrinogen. 425. 30. 20. 375. p < 0,004. 10. 325. 0. 275. ret (-). ret (+). 225. p < 0,04. 175. ret (-). ret (+). 8000. 6000. 4000. White blood cells. 2000. Figure 1. 0. ret (-). ret (+). 60. 55. 50. 45. 40. 35.

p < 0,01
E N D
Presentation Transcript
Inflammation Markers 50 p < 0,01 VES 40 fibrinogen 425 30 20 375 p < 0,004 10 325 0 275 ret (-) ret (+) 225 p < 0,04 175 ret (-) ret (+) 8000 6000 4000 White blood cells 2000 Figure 1 0 ret (-) ret (+)
60 55 50 45 40 35 30 25 20 15 10 Glucose disposal rate (µmol.min-1.kgFFM-1) ± S.D. none ret (+) Figure 2
Plasma insulin concentrations and exogenous glucose infusion rates in patients without or with retinopathy 100 4,0 80 3,0 Glucose infusion rate mg.Kg.min 60 2,0 Plasma insulin (µU/ml) 40 1,0 20 0 0,0 120 4,0 100 80 3,0 Glucose infusion ratemg.Kg.min 60 2,0 Plasma insulin (µU/ml) 40 1,0 20 0 0,0 Time (min ) 0 60 80 120 150 Figura 3