Task Force Group on Identification and Assessment of Recommended Practices for the Design of Internet Surveys
200 likes | 552 Vues
Task Force Group on Identification and Assessment of Recommended Practices for the Design of Internet Surveys. Task Force Members

Task Force Group on Identification and Assessment of Recommended Practices for the Design of Internet Surveys
E N D
Presentation Transcript
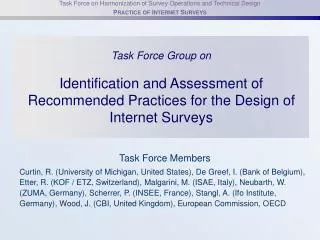
Task Force Group onIdentification and Assessment of Recommended Practices for the Design of Internet Surveys Task Force Members Curtin, R. (University of Michigan, United States), De Greef, I. (Bank of Belgium), Etter, R. (KOF / ETZ, Switzerland), Malgarini, M. (ISAE, Italy), Neubarth, W. (ZUMA, Germany), Scherrer, P. (INSEE, France), Stangl, A. (Ifo Institute, Germany), Wood, J. (CBI, United Kingdom), European Commission, OECD
Time-lag (ca. 45 months) Web as Survey Medium Internet users per 100 inhabitants, by country-income level 80 70 Country Groups High income Upper middle 60 Lower middle Low income 50 40 30 20 10 0 1996 1997 1998 1999 2000 2001 2002 2003 Source: adapted from OECD Communications Outlook 2005
Characteristics of Internet surveys SPECIFICS • Web as a survey medium • Sources of the coverage and measurement error • Users’ specifics: hardware and software • Validity and reliability issues • Data security • User friendliness • ADVANTAGES • Material savings • Postal expenditure • Archive requirements • Lower marginal costs • Accessibility around the clock • No interviewer bias • Positive effect on the surveyor’s image
Coverage Problems Percentage of Businesses Using the Internet by Number of Employees 10-49 50-249 250 and more % 100 90 80 70 60 50 UK Italy Japan Spain Ireland Mexico Austria Canada Norway Greece Finland Portugal Sweden Denmark Germany Australia Czech Rep. Switzerland Netherlands New Zealand Luxembourg 2001 or latest available year Source: OECD
Survey-Mode Preferences Among International Business Survey Participants Fax Web E-mail 70% 60% 50% 55% 51% 46% 44% 40% 44% 41% 40% 39% 38% 30% 34% 34% 32% 26% 28% 20% 9% 10% 0% <34 35-44 45-54 55-65 >66 Age Group N=433, multiple-choice Source: Ifo Institute for Economic Research (2004): Ifo World Economic Survey
Mixed Mode Surveys ADVANTAGES • Respondents can choose the mode • Allows a stepwise adoption of the Internet • Different modes function as “soft” reminders DATA QUALITY • Differences in item non-response, validity, reliability Differently designed questionnaires may result in systematic measurement errors
Item Non-response Lower item non-response for Web surveys ! On-line participants tend to be less thorough • Internet is perceived to be anonymous • Lower perception of responsibility • On-line readers are less patient • Internet usage is associated with costs
Dial-up and Broadband Shares, 2003 Broadband Dial-up 100% 80% 60% 40% 20% 0% Italy Spain Korea Japan Austria Mexico Ireland Finland Poland Turkey Belgium Iceland France Norway OECD EU-15 Portugal Australia Greece Hungary Sweden Canada Denmark Germany Switzerland Luxembourg Netherlands United States New Zealand United Kingdom Slovak Republic Czech Republic Source: OECD Communications Outlook 2005
Validity – Differences in Responses • Findings vary greatly Balances of the assessments of the present economic situation (IT companies) 70 60 Total Panel Web Respondents 50 40 30 20 10 0 -10 -20 -30 Q2/2000 Q3/2000 Q4/2000 Q1/2001 Q2/2001 Q3/2001 Q4/2001 Q1/2002 Q2/2002 Q3/2002 Q4/2002 Q1/2003 Q2/2003 Q3/2003 Q4/2003 Q1/2004 Q2/2004 Q1/2000 -40 Selection bias may influence responses
Reliabilty Higher risk of measurement errors • Internet respondents tend to read more quickly • Internet environment may lead to a higher inaccuracy • Respondent has to learn the structure of the hypertext • Internet questionnaires affords higher cognitive effort Prevention and Control Personal contact Design Instructions
Optical Design DOs • Welcome and attractive screen • Different forms for different questions • Minimize visible control functions • Multi-page design for automatic skipping • Use only the central part of the screen • … DON’Ts • Matrix questions • Drop-down menus • Pop-up questions • Sideward scrolling • … WebSM Web Survey Methodology www.WebSM.org
Practical Issues: SPAM • Address list cleanliness • Ask your participants to place your e-mail address in their address book • Adhere to a widely accepted format (plain-text format) • Avoid using bought-in e-mail lists • Avoid spammy-sounding words in your e-mail • Use a recognizable, short, and consistent “From” Address. • Test your e-mail campaign Permanent challenge
Practical Issues: Security Security breaches can appear: • Unauthorized subjects try to access sensitive information • Cyber-criminals and hackers • Viruses and Spyware • Security breaches during the data transmission Effective security policy
Effective security policy ! • Create awareness of possible risks • Anti-Virus and anti-Trojans software • A strong Firewall • SSL / TLS
Internet Surveys of the Future • Conception • Higher Internet Competence • Adoption • Training • DSL • Technical Progress • Higher screen • resolution • Advanced design techniques • Fingerprint • TSL • New Security Generation
Broadband Internet Connections Internet subscribers (Millions) 300 Total Internet subscribers (including broadband) 250 Broadband subscribers 200 150 100 50 0 1999 2000 2001 2002 2003 Source: OECD Communications Outlook 2005
Quality of Service Improvements Faults per 100 lines per year 70 1990 2003 60 50 40 30 20 10 0 Spain Korea Ireland Turkey Mexico Portugal Greece Hungary Canada Switzerland United Kingdom
50% 15% 40% 10% 30% Percent Percent 20% 5% 10% 0% good bad satisfactory satisfactory good bad Present Economic Situation (Categories) Present Economic Situation (Visual Analog Scale) New Instruments – Graphic Scales Categories Visual Analog Scales bad satisfactory good bad satisfactory good ¨ ¨ ¨
Task Force Outlook • Exchange experience • Contrast recommendations and practice • Design • Data quality • Contact with participants • Technical issues • Learn from each other
Thank You! Email: Ronny Nilsson Ronny.NILSSON@oecd.org Anna Stangl Stangl@ifo.de