Download
1 / 10
190 likes | 416 Vues
Learn about EBK, a robust geoprocessing tool for interpolation. Discover its advantages, disadvantages, modeling process, and new regression prediction feature in ArcGIS Pro.

E N D
Empirical Bayesian Kriging and EBK Regression Prediction – Robust Kriging as Geoprocessing Tools Eric Krause
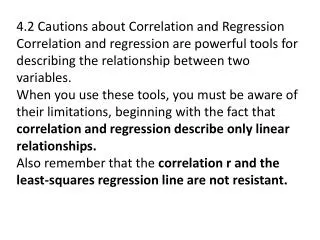
What is interpolation? • Predict values at unknown locations using values at measured locations • Many interpolation methods: kriging, IDW, LPI, etc
Empirical Bayesian Kriging • Advantages • Requires minimal interactive modeling, spatial relationships are modeled automatically • Usually more accurate, especially for small or nonstationary datasets • Uses local models to capture small scale effects • Doesn’t assume one model fits the entire data • Standard errors of prediction are more accurate than other kriging methods • Disadvantages • Processing is slower than other kriging methods • Limited customization
How does EBK work? • Divide the data into subsets of a given size • Controlled by “Subset Size” parameter • Subsets can overlap, controlled by “Overlap Factor” • For each subset, estimate the semivariogram • Simulate data at input point locations and estimate new semivariogram from the simulated data • Repeat step 3 many times. This results in a distribution of semivariograms • Controlled by “Number of Simulations” • Mix the local surfaces together to get the final surface.
EBK Regression Prediction • New tool available in ArcGIS Pro 1.2 • Allows you to use explanatory variable rasters to improve predictions • Automatically extracts useful information from explanatory variables • Uses Principle Components to handle multicollinearity
Transformations • Two available transformations • Empirical – Fits a smooth distribution to the data, then transforms to normal distribution. Useful for data that is not bell-shaped • Log Empirical – Takes logarithm of data before performing Empirical transformation. Useful for data that cannot be negative (eg, rainfall)
Data in Geographic Coordinate Systems • Euclidean distance for geographic coordinates is very inaccurate, particularly far from the equator • In ArcGIS 10.3, EBK uses chordal distances • Chordal distance is the 3D straight-line distance between points on a spheroid • Accurate approximation to geodesic distance up to 30 degrees
Demo Empirical Bayesian Kriging and EBK Regression Prediction Eric Krause Eric Krause