Download
1 / 44
440 likes | 455 Vues
Understand project control through EVM: setting baseline plan, measuring progress, comparing actual vs plan, taking corrective action. Learn how EVM quantifies project value and tracks performance effectively.

E N D
Project Management Monitoring and Control using Earned Value Management (EVM) Minder Chen, Ph.D. CSU Channel Islands Minder.chen@csuci.edu Free download EVM for Dummies (link)
Monitoring and Control 1 2 3
Control • Control is the process of comparing actual performance against plan to identify deviations, evaluate possible alternative courses of actions, and take appropriate corrective action. • The project control steps for measuring and evaluating project performance are presented below: 1. Setting a baseline plan. 2. Measuring progress and performance. 3. Comparing plan against actual. 4. Taking action.
Planning Process Costs/Budget
Using Gantt Chart for Project Control http://en.wikipedia.org/wiki/File:GanttChartAnatomy.svg
Interaction of WBS and OBS Establishes the Control Accounts http://www.humphreys-assoc.com/evms/basic-concepts-earned-value-management-evm-ta-a-74.html
Budget http://pm-foundations.com/tag/project-budgeting/
PM Information System Overview 1 2 -phased Resource Schedule 1 Time-phased Budget 3
Earned Value Management (EVM) • Monitoring your project’s performance involves determining whether you’re on, ahead of, or behind schedule and on, under, or over budget. But just comparing your actual expenditures with your budget can’t tell you whether you’re on, under, or over budget — which is where EVM comes in. • The basic premise of earned value management (EVM) is that the value of a piece of work is equal to the amount of funds budgeted to complete it. http://www.dummies.com/how-to/content/earned-value-management-terms-and-formulas-for-pro.html
Earned Value Management (EVM) • Important questions for controlling projects: Did I get my money’s worth? Did I spend my hours, days and weeks wisely? • Earned Value Management (EVM) has been used to answer these basic questions. EVM uses a common set of units ($$$) to compare the funds spent, the work planned, the work done and the passage of time. • Quantifying (in budget terms) the value of all project tasks (work packages) • Looking at the dates work or products are supposed to be done • Seeing when the work is actually done • Recording how much was spent completing the work. http://www.pmi.org/Why-Earned-Value-Management-Works.aspx
Earned Value • The earned value system starts with the time-phased costs that provide the project budget baseline, which is called the planned budgeted value of the work scheduled (PV). Given this time-phased baseline, comparisons are made with actual and planned schedule and costs using earned value. • At the work package level, collect the actual costs for the work performed. These costs will be called the actual costof the work completed (AC). • ** Collect percent complete and multiply this times the original budget amount for the value of the work actually completed. These values will be called earned value (EV). • The unique EVM element is the value of completed work. In EVM, work is worth what is budgeted to complete it, not what was spent to complete the work. It is not necessary to know how much was spent to determine the EV.
PV, EV, AC • Planned value (PV): The approved budget for the work scheduled to be completed by a specified date; also referred to as the budgeted cost of work scheduled (BCWS). The total PV of a task is equal to the task’s budget at completion (BAC)— the total amount budgeted for the task. • Earned value (EV): The approved budget for the work actually completed by the specified date; also referred to as the budgeted cost of work performed (BCWP). • Actual cost (AC): The costs actually incurred for the work completed by the specified date; also referred to as theactual cost of work performed(ACWP).
Percent Complete Rule • This rule is the heart of any earned value system. The best method for assigning costs to the baseline under this rule is to establish frequent checkpoints over the duration of the work package and assign completion percentages in dollar terms. • For example, units completed could be used to assign baseline costs and later to measure progress. Units might be lines of code, hours, drawings completed, cubic yards of concrete in place, workdays, prototypes complete, etc. This approach to percent complete adds “objectivity” to the subjective observation approaches often used. • When measuring percent complete in the monitoring phase of the project, it is common to limit the amount earned to 80 or 90 percent until the work package is 100 percent complete.
How to Determine a Task’s Earned Value • Percent-complete method: EV is the product of the fraction representing the amount of an activity that has been completed and the total budget for the activity. This method is potentially the most accurate if you correctly determine the fraction of the activity you have completed. However, because that estimate depends on your subjective judgment, this approach is also most vulnerable to errors or purposeful manipulation. • Milestone method:EV is zero until you complete the activity, and it’s 100 percent of the total activity budget after you complete it. The milestone method is the most conservative and the least accurate. You expect to spend some money while you’re working on the task. However, this method doesn’t allow you to declare EV greater than $0 until you’ve completed the entire activity. Therefore, you’ll always appear over budget while you perform the activity. • 50/50 method:EV is zero before you start the activity, 50 percent of the total activity budget after you start it, and 100 percent of the activity budget after you finish the activity. The 50/50 method is a closer approximation to reality than the milestone method because you can declare an EV greater than $0 while you perform the task. However, this approximation can inadvertently mask overspending.
Example http://www.dummies.com/how-to/content/how-to-determine-a-tasks-earned-value.html
Summarize EVM Data via WBS or OBS The variance calculations are typically done at the control account level which provides the ability to summarize the data up through the WBS and/or the OBS.
Varainces • Schedule variance (SV): The difference between the amounts budgeted for the work you actually did and for the work you planned to do. The SV shows whether and by how much your work is ahead of or behind your approved schedule. SV = EV - PV • Cost variance (CV): The difference between the amount budgeted and the amount actually spent for the work performed. The CV shows whether and by how much you’re under or over your approved budget. CV = EV – AC A positive variance indicates a desirable condition, while a negative variance suggests problems or changes that have taken place.
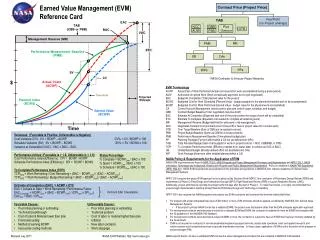
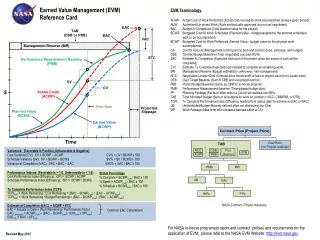
Cost/Schedule Graph Estimated cost At Completion Budgeted cost At Completion CV = EV - AC SV = EV - PV Using the money to represent how much has been completed.
Earned Value Review • Assessing the current status of a project using the schedule variance (SV) and cost variance (CV) are computed each reporting period. • A positive variance indicates a desirable condition, while a negative variance suggests problems or changes that have taken place.
Performance Index Planned value (PV) Earned value (EV) Actual cost (AC) • CV = EV – AC • SV = EV - PV • Cost performance index (CPI) = EV/AC • Scheduling performance index (SPI) = EV/PV
Performance Measure To describe your project’s schedule and cost performance with EVM, you use the following indicators: • Schedule performance index (SPI): The ratio of the approved budget for the work performed to the approved budget for the work planned. The SPI reflects the relative amount the project is ahead of or behind schedule, sometimes referred to as the project’s schedule efficiency. You can use the SPI to date to project the schedule performance for the remainder of the task. • Cost performance index (CPI): The ratio of the approved budget for work performed to what you actually spent for the work. The CPI reflects the relative value of work done compared to the amount paid for it, sometimes referred to as the project’s cost efficiency. You can use the CPI to date to project the cost performance for the remainder of the task. With this information can we answer the key questions, “Did we spend our money well?”, and “Did we use the time we had efficiently.”
Case Study • Cost performance index (CPI) = EV/AC = 160/230 = .696 or .70 • Scheduling performance index (SPI) = EV/PV =160/200 = .80 • Percent complete index (PCIB) in terms of budget amounts = EV/BAC = 160/320 = .50 (50%) • Percent complete index (PCIC) in terms of actual dollars spent = AC/EAC = 230/459 = .50 (50%) EAC: actual expected dollars for the completed project
Estimate cost To Complete (ETC) • EAC forecast for ETC work performed at the budgeted rate. This EAC method accepts the actual project performance to date (whether favorable or unfavorable) as represented by the actual costs, and predicts that all future ETC work will be accomplished at the budgeted rate. Equation: EAC = AC + (BAC – EV) • EAC forecast for ETC work performed at the present CPI. The ETC work is assumed to be performed at the same cumulative cost performance index (CPI) as that incurred by the project to date. Equation: EAC = BAC / CPI • EAC forecast for ETC work considering both SPI and CPI factors. In this forecast, the ETC work will be performed at an efficiency rate that considers both the cost and schedule performance indices. This method is most useful when the project schedule is a factor impacting the ETC effort. Variations of this method weight the CPI and SPI at different values (e.g., 80/20, 50/50, or some other ratio) according to the project manager’s judgment. Equation: EAC = AC + [(BAC – EV) / (CPI × SPI)]
Risk Management http://www.mybusinessprocess.net/wp-content/uploads/2012/01/Risk-Management-Process-3.jpg