Download
1 / 58
580 likes | 687 Vues
Learn about partitional and hierarchical clustering methods, defining clusters, cluster analysis, limitations, algorithms, and validity measurements in computational biology. Explore cluster similarities, merging techniques, and visualizing dendrogram trees for data interpretation.

E N D
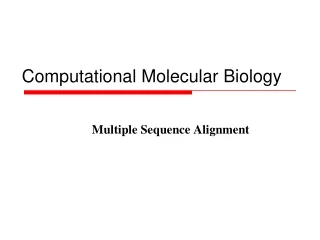
Computational Biology Clustering Parts taken from Introduction to Data Mining by Tan, Steinbach, Kumar Lecture Slides Week 9
Clustering • A clustering is a set of clusters • Important distinction between hierarchical and partitionalsets of clusters • Partitional Clustering • A division data objects into non-overlapping subsets (clusters) such that each data object is in exactly one subset • Hierarchical clustering • A set of nested clusters organized as a hierarchical tree
Partitional Clustering A Partitional Clustering Original Points
Hierarchical Clustering Traditional Hierarchical Clustering Traditional Dendrogram Non-traditional Hierarchical Clustering Non-traditional Dendrogram
Notion of a Cluster can be Ambiguous How many clusters? Six Clusters Two Clusters Four Clusters
What is Cluster Analysis? Inter-cluster distances are maximized Intra-cluster distances are minimized • Finding groups of objects such that the objects in a group will be similar (or related) to one another and different from (or unrelated to) the objects in other groups
10 Clusters Example Starting with two initial centroids in one cluster of each pair of clusters
10 Clusters Example Starting with two initial centroids in one cluster of each pair of clusters
10 Clusters Example Starting with some pairs of clusters having three initial centroids, while other have only one.
10 Clusters Example Starting with some pairs of clusters having three initial centroids, while other have only one.
Limitations of K-means: Differing Sizes K-means (3 Clusters) Original Points
Limitations of K-means: Differing Density K-means (3 Clusters) Original Points
Limitations of K-means: Non-globular Shapes Original Points K-means (2 Clusters)
Hierarchical Clustering • Produces a set of nested clusters organized as a hierarchical tree • Can be visualized as a dendrogram • A tree like diagram that records the sequences of merges or splits
Starting Situation p1 p2 p3 p4 p5 . . . p1 p2 p3 p4 p5 . . . • Start with clusters of individual points and a proximity matrix Proximity Matrix
Intermediate Situation C1 C2 C3 C4 C5 C1 C2 C3 C4 C5 • After some merging steps, we have some clusters C3 C4 Proximity Matrix C1 C5 C2
Intermediate Situation C1 C2 C3 C4 C5 C1 C2 C3 C4 C5 • We want to merge the two closest clusters (C2 and C5) and update the proximity matrix. C3 C4 Proximity Matrix C1 C5 C2
After Merging • The question is “How do we update the proximity matrix?” C2 U C5 C1 C3 C4 C1 ? ? ? ? ? C2 U C5 C3 C3 ? C4 ? C4 Proximity Matrix C1 C2 U C5
How to Define Inter-Cluster Similarity p1 p2 p3 p4 p5 . . . p1 p2 p3 p4 p5 . . . Similarity? • MIN • MAX • Group Average • Distance Between Centroids • Other methods driven by an objective function • Ward’s Method uses squared error Proximity Matrix
How to Define Inter-Cluster Similarity p1 p2 p3 p4 p5 . . . p1 p2 p3 p4 p5 . . . • MIN • MAX • Group Average • Distance Between Centroids • Other methods driven by an objective function • Ward’s Method uses squared error Proximity Matrix
How to Define Inter-Cluster Similarity p1 p2 p3 p4 p5 . . . p1 p2 p3 p4 p5 . . . • MIN • MAX • Group Average • Distance Between Centroids • Other methods driven by an objective function • Ward’s Method uses squared error Proximity Matrix
How to Define Inter-Cluster Similarity p1 p2 p3 p4 p5 . . . p1 p2 p3 p4 p5 . . . • MIN • MAX • Group Average • Distance Between Centroids • Other methods driven by an objective function • Ward’s Method uses squared error Proximity Matrix
How to Define Inter-Cluster Similarity p1 p2 p3 p4 p5 . . . p1 p2 p3 p4 p5 . . . • MIN • MAX • Group Average • Distance Between Centroids • Other methods driven by an objective function • Ward’s Method uses squared error Proximity Matrix
Cluster Similarity: MIN or Single Link 1 2 3 4 5 • Similarity of two clusters is based on the two most similar (closest) points in the different clusters • Determined by one pair of points, i.e., by one link in the proximity graph.
Hierarchical Clustering: MIN 5 1 3 5 2 1 2 3 6 4 4 Nested Clusters Dendrogram
Measuring Cluster Validity Via Correlation • Two matrices • Proximity Matrix • “Incidence” Matrix • One row and one column for each data point • An entry is 1 if the associated pair of points belong to the same cluster • An entry is 0 if the associated pair of points belongs to different clusters • Compute the correlation between the two matrices • Since the matrices are symmetric, only the correlation between n(n-1) / 2 entries needs to be calculated. • High correlation indicates that points that belong to the same cluster are close to each other. • Not a good measure for some density or contiguity based clusters.
Measuring Cluster Validity Via Correlation • Correlation of incidence and proximity matrices for the K-means clusterings of the following two data sets. Corr = -0.9235 Corr = -0.5810
Using Similarity Matrix for Cluster Validation • Order the similarity matrix with respect to cluster labels and inspect visually.
End Theory I • 5 min mindmapping • 10 min break
Clustering Dataset • We will use the same datasets as last week • Have fun clustering with Orange • Try K-means clustering, hierachial clustering, MDS • Analyze differences in results
K? • What is the k in k-means again? • How many clusters are in my dataset? • Solution: iterate over a reasonable number of ks • Do that and try to find out how many clusters there are in your data
End Practice I • 15 min break
Theory II Microarrays
Microarrays Gene Expression: We see difference between cels because of differential gene expression, Gene is expressed by transcribing DNA intosingle-stranded mRNA, mRNA is later translated into a protein, Microarrays measure the level of mRNA expression
Microarrays Gene Expression: mRNA expression represents dynamic aspects of cell, mRNA is isolated and labeled using a fluorescent material, mRNA is hybridized to the target; level of hybridization corresponds to light emission which is measured with a laser
Processing Microarray Data Differentiating gene expression: R = G not differentiated R > G up-regulated R < G down regulated
Processing Microarray Data Problems: Extract data from microarrays, Analyze the meaning of the multiple arrays.
Processing Microarray Data Problems: Extract data from microarrays, Analyze the meaning of the multiple arrays.
Processing Microarray Data Microarray data:
Processing Microarray Data Clustering: Find classes in the data, Identify new classes, Identify gene correlations, Methods: K-means clustering, Hierarchical clustering, Self Organizing Maps (SOM)
Processing Microarray Data Distance Measures: Euclidean Distance: Manhattan Distance:
Processing Microarray Data K-means Clustering: Break the data into K clusters, Start with random partitioning, Improve it by iterating.
Processing Microarray Data Agglomerative Hierarchical Clustering:
Processing Microarray Data Self-Organizing Feature Maps: by Teuvo Kohonen, a datavisualization technique which helps to understand highdimensional data by reducing the dimensions of data to amap.
Processing Microarray Data Self-Organizing Feature Maps: humans simply cannot visualize high dimensional data as is, SOM help us understand this highdimensional data.