Download
1 / 6
60 likes | 79 Vues
Explore police incident data from Greater Manchester Police's Twitter posts on a busy day. Engage students in analyzing incident types and time spent. Enhance representing skills and functional math. Suitable for group work.

E N D
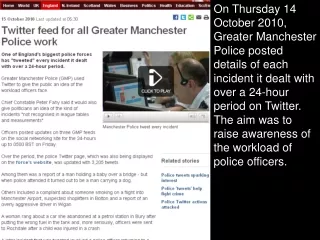
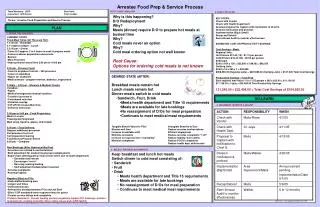
On Thursday 14 October 2010, Greater Manchester Police posted details of each incident it dealt with over a 24-hour period on Twitter. The aim was to raise awareness of the workload of police officers.
3 205 ‘tweets’ were made in the 24-hour period. What was the busiest time? How much time did the police spend on each different type of incident that day?
It’s in the News!Police Tweets Teacher Notes
Police Tweets Introduction: On 14 October 2010 Greater Manchester Police used the social networking site Twitter to give details of every incident they dealt with over a 24-hour period. The police ‘tweeted’ 3 205 separate incidents in this time, including one person calling to complain that their builder had turned up two months late and another saying that their television wasn’t working. These trivial distractions sit alongside much more serious crimes and illustrate the variety and intensity of the work of the force. These ‘tweets’ are recorded on the police force’s website and are used in this resource to provide a context for students to develop their representing skills, one of the KS3 process skills and a part of Functional Maths. Content objectives: This context provides the opportunity for teachers and students to explore a number of objectives. Some that may be addressed are: • break down substantial tasks to make them more manageable; represent problems and synthesise information in algebraic, geometrical or graphical form; move from one form to another to gain a different perspective on the problem • select, construct and modify, on paper and using ICT, suitable graphical representations to progress an enquiry and identify key features present in the data. Process objectives: These will depend on the amount of freedom you allow your class with the activity. It might be worth considering how you’re going to deliver the activity and highlighting the processes that this will allow on the diagram below:
Activity: There are two activities offered. The first activity is presented as a starter activity to give students the opportunity to familiarise themselves with the data and to understand the issues when dealing with a fairly large set of raw data. Students are asked to decide in which period of the 24 hours the police were most busy. This initially straightforward task could be as simple as detailing the number of incidents received in each hour but, if you would like to make this a larger activity, students could consider whether different types of incident generate more work and, therefore, whether the type of incident being reported would impact on how busy the police were at any given time. This might be used as a lead into the second activity which asks students to decide how long the police spent on different types of incident that day. Students can interpret this question at a number of levels and the amount of scaffolding you offer will depend on your class. Decisions that the groups will need to address might include what are the different categories of incident, will they sample the data or use the whole set, how will they record their data and how will they present their findings. You might choose to present these questions to the group or, if your class is more able, present the task more openly. If your class is less used to making decisions then you might like to offer categories or a sampling strategy but this will reduce the level of challenge for the activity. Differentiation: The content of this task is relatively low, the organisation and logic of the task can, however, end up being quite challenging. You may decide to change the level of challenge for your group. One of the objectives for this task might be for students to experiment with different approaches to a problem, to show resilience. It is worth considering what pedagogy would support this objective. To make the task easier you could consider: • giving the class the categories that you expect them to use for the data (this might be as simple as serious and not serious) • detailing how you want them to sample the data • detailing how you expect them to record their data – maybe offering a tally chart • sorting the data, only offering them a small selection to work with. To make the task more complex you could consider: • removing the scaffolding, asking the group to decide what to do and how to do it (you might offer some support in the form of this Wordle • asking for a written report on how the police spend their time. This resource is designed to be adapted to your requirements. Working in groups: This activity lends itself to paired work and small group work and, by encouraging students to work collaboratively, it is likely that you will allow them access to more of the key processes than if they were to work individually. You will need to think about how your class will work on this task. Will they work in pairs, threes or larger groups? If pupils are not used to working in groups in mathematics you may wish to spend some time talking about their rules and procedures to maximise the effectiveness and engagement of pupils in groupwork (You may wish to look at the SNS Pedagogy and practice pack Unit 10: Guidance for groupwork). You may wish to encourage the groups to delegate different areas of responsibility to specific group members.
Assessment: You may wish to consider how you will assess the task and how you will record your assessment. This could include developing the assessment criteria with your class. You might choose to focus on the content objectives or on the process objectives. You might decide that this activity lends itself to comment only marking or to student self assessment. If you use the APP model of assessment then you might use this activity to help you in building a picture of your students’ understanding. Assessment criteria to focus on might be: • show understanding of situations describing them mathematically using symbols, words and diagrams (using and applying mathematics level 5) • solve problems and carry through substantial tasks by breaking them into smaller, more manageable tasks, using a range of efficient techniques, methods and resources, including ICT (using and applying mathematics level 6) • distinguish between practical demonstration and proof; know underlying assumptions, recognising their importance and limitations, and the effect of varying them (using and applying mathematics level 8). Probing questions: These might include: • what will your categories be? Why have you chosen these? • how will you decide which categories to use? • how will you represent your findings? Can you show it graphically? • why have you represented the data that way? • how large a sample will you need to take to get a picture of the data? • how do you know that your sample is representative? You will need: The 3 205 Tweets are recorded on the police force website, and are also presented as a spreadsheet. This Wordle might also be useful to help students access the information. You will also need the PowerPoint presentation. There are just two slides: The first slide sets the scene The second slide shows a few of the tweets and poses the two questions ‘what was the busiest time?’ and ‘How much time did the police spend on each different type of incident that day?’


![I like [ hour / our ] team the best. hour our](https://cdn1.slideserve.com/2584921/slide1-dt.jpg)