Download
1 / 24
1.16k likes | 4.23k Vues
SMART Water Management PWC’17 Samoa - 10 August 2017 Presentation by Richard Taylor, Thomas Consultants, Auckland. SMART Water Management. What basic data sets do water utilities have access to?. FLOW (water meter data) PRESSURE data.

E N D
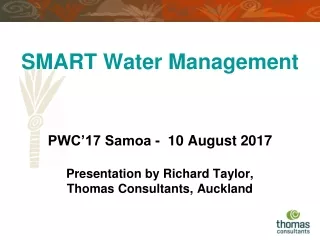
SMART Water ManagementPWC’17 Samoa - 10 August 2017Presentation by Richard Taylor, Thomas Consultants, Auckland
What basic data sets do water utilities have access to? FLOW (water meter data) PRESSURE data
What basic data sets do water utilities have access to? RESERVOIR Water Level Data PUMP STATION Data (No. pump starts/stops & run hours)
What equipment do you need? DATALOGGER (GSM etc) SCADA (telemetry/radio) (with pulse units and pressure transducers)
FLOW (and Volume) Data Annual Totals – year on year comparison reflecting growth, climatic factors, demand management programmes. Past 5 to 10 years shows trends Monthly Demand – shows seasonal variation in demand. Past 3 to 5 years of data should show trends adequately Daily Demand – shows changes in water use week days, Saturday, Sunday and on public holidays
FLOW Data & Profiles (2) Hourly Demand – 24 hour profile, for different days of the week and public holidays. Shows peak demand which is the critical design requirement for networks (peak 30 or 45 minute). (this is when pressure complaints will be received) Minimum Night Flows – these are commonly used to get a good indication of the level of leakage in the network
Example of Daily Demand over Two Years showing Seasonal Fluctuation
Example of Typical 24 Hour Water Demand Profile (and missing data)
Variations in Demand - Water Losses (examples of high and low levels of leakage)
SCADA Screen Shots former Waitakere City Council – Flow and pressure from one site
SCADA Screen Shots former Waitakere City Council – Zone flows and pressure
SCADA Screen Shots former Waitakere City Council – Zone Data
SCADA Screen Shots former Waitakere City Council – Leakage (MNF) Monitoring
PRESSURE Control and Data Supply pressures can be controlled based on flow and pressure data (at critical point)
PRESSURE Control and Data PRV with hydraulic flow modulation
LATEST TECHNOLOGY • Sophisticated Data Analysis • High Rate Pressure Logging.
LATEST TECHNOLOGY • Sophisticated Data Analysis • Using advanced statistical and mathematical algorithms, XXXXX harnesses utility data, translating it into actionable insights and transforming the way water networks operate. The solution offers a comprehensive decision-making platform that can be integrated across the utility. It enables water utilities to improve efficiency and make smarter decisions.
High Rate Pressure Logging • 250 pressure readings per second • Data timestamped and transmitted every minute • Data analysed and • events reported • within 20 mins • Other trends/info • reported
To Summarise (1) • Water Utilities worldwide are now being SMARTER by using data and information to help make better decisions and to improve operational responses; • Flow and pressure data, recorded and analysed in a timely manner, can provide significant benefits, such as responding quickly to network faults;
To Summarise (2) • The cost to implement monitoring and communications systems can now be considered ‘affordable’; and • The benefits of implementing these systems, from both an operational and asset management perspective, are known to easily outweigh and justify the cost of implementing the systems.
I encourage you to become a SMART Water Utility. Any Questions?