Download
1 / 28
280 likes | 418 Vues
Databases of Infrared Molecular Parameters for Astronomy 0.7 to 1000 μm (14000 to 10 cm -1 ). . Linda R. Brown Jet Propulsion Laboratory California Institute of Technology Pasadena, CA 91109 linda.brown@jpl.nasa.gov

E N D
Databases of Infrared Molecular Parameters for Astronomy 0.7 to 1000 μm (14000 to 10 cm-1) . Linda R. Brown Jet Propulsion Laboratory California Institute of Technology Pasadena, CA 91109 linda.brown@jpl.nasa.gov The research at the Jet Propulsion Laboratory (JPL), California Institute of Technology was performed under contracts with the National Aeronautics and Space Administration.
Basic transition line parameters: ●Line position (or center frequency) ●Line intensity@ 296 K ●Lower state energy (for temperature dependence) ●Vibrational - rotational quantum assignment Line shape parameters (Voigt) ●Pressure-broadened widths & temperature depend. ●Pressure-induced frequency shifts ●Self-broadened widths Line mixing (limited to CO2; no temp. depend) (Other line shapes: none) ●Continua: collision-induced absorption (CIA) (given as cross section files)
Can’t find your molecule?Try semi-public customized collections
File Structure of HITRAN Compilation (Java HAWKS) Software and Documentation Level 1 HITRAN (line-transition parameters) IR Cross-sections UV Line Coupling CO2 data Aerosol Refractive Indices Level 2 Data Global Data Files, Tables, and References Line-by-line Cross-sections Supplemental Supplemental Alternate Molecule- by-molecule Level 3
A water transition in 2004 HITRAN:11139.7826043.822E-191.168E+00.0659.4228446.69660.590.0019700 0 0 0 0 07 1 7 6 0 6555243332168510224*15.0 13.0 > 4 good < 3 bad 0 = old (1986)
CDMS main page "www.cdms.de"
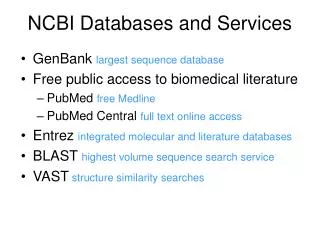
Properties of the CDMS Catalog • (Mostly) rotational transitions of species for astrophysics and astrochemistry • Molecules detected or detectable in inter/circumstellar medium • Emphasis on Submillimeter and TeraHertz regions • Predictions based on modeling experimental frequencies via Hamiltonians • Separate entries for rarer isotopomers or excited vibrational states (1-1) • Recent entries include • – light hydrides and deuterated species: HD2+, NH, ND, CH2D+, NH2D, NHD2, ND3 • – molecules in excited vibrational states: HCN, HNC, HC3N, HC5N, CS, SiO • – complex species: ethylene glycol • > 300 entries as of April 2005 • Format identical to that of JPL catalog Holger Muller: private communication
MASTER: Millimeterwave Acquisitions for Stratospheric/Tropospheric Exchange Research Initial Source of Line Parameters Positions: JPL (almost always) Intensities: JPL or HITRAN or new calculations line broadening: literature or new measurements or HITRAN line shift:literature or new measurements + Interfering species Target molecules H2O O3 HNO3O2N2OHCl CO CH3Cl ClO BrO HOCL HOBr COF2H2O2HO2 H2CO OCSSO2NO2 HCN
Line-by-line parameters should be COMPLETE and ACCURATE (ENOUGH) ACCURACIES REQUIRED FOR MANY APPLICATIONS νPositions & δpressure-induced shifts: 0.000001 - 1.0 cm-1 SLine intensities: 1 to 10% E″ Lower states energies: ½% γPressure-broadening widths: 1 to 20 % ηTemperature dependence of widths: 10 to 40%
METHODS TO OBTAIN SPECTROSCOPIC PARAMETERS ●Calculations based on successful theoretical modeling (good for positions and intensities, but not line shapes) ●Predictions based on limited data and/or poorer theoretical modeling (warning: extrapolations very poor!) ●Empirical data retrieved line-by-line with some known assignments (warning: no weak lines, larger uncertainties!) ●Absorption cross sections from lab spectra, sometimes at different temperatures (for unresolved heavy species and continua)
Near-IR Methane Positions and Intensities:Difficult to model because energy levels perturb each other. Triacontad: intractable: Cross sections or empirical linelist with 1% assignments. Icosad: almost intractable, but one strong band being studied. Tetradecad: region largely unassigned; no public prediction. Empirical linelist has strongest lines. Octad: poorer prediction overwritten by some empirical results for main isotope. Pentad fundamentals and overtones modeled in 3 isotopes; Hot bands intensities are estimated. Dyad and CH3D fundamentals good. Hot bands intensities modeled to 8%. GS predicted using measured frequencies. Intensities are uncertain and not validated! cm-1
Far-IR CH4 Intensities for ground state transitions in HITRAN and GEISA low by 16%? HITRAN intensities for Far IR set by one “indirect method”, (calc.) [Hilico et al., J Mol Spec, 122, 381(1987)] with claim of accuracy of ± 30%. Cassam-Chenai, [JQSRT, 82,251(2003)] predicts ab initio Q branch based on Stark measurements [Ozier et al. Phys Rev Lett, 27,1329, (1971)]. The intensities are 16% higher than HITRAN values. Lab data (left) confirms a higher value for R branch manifolds. hitran fit from Orton Lab Spectra of Far-IR CH4 (Wishnow)
HITRAN 2004 Far-IR Water Positions (frequencies) well-studied
H2O Line Intensities All isotopologues important but not validated
Warnng! Warning!Far-IR Water Intensities are not measured IsotopeIntensity accuracy and source 11 139.782604 3.822E-19 1.168E+00.0659.4228 446.69660.590.001970 0 0 0 0 0 0 7 1 7 6 0 6 55524333216851 224 15.0 13.0 13 139.997467 1.344E-22 6.538E-01.0919.4389 275.13050.690.004310 0 0 0 0 0 0 5 2 4 4 1 3 50524334226851 224 66.0 54.0 15 140.235360 8.173E-27 1.485E-01.0668.3300 801.35910.490.000000 0 0 0 0 0 0 9 4 6 8 4 5 50554032227 5 2 0 114.0 102.0 14 140.252640 1.725E-24 1.225E-01.0648.3080 942.53220.490.000000 0 0 0 0 0 0 9 5 5 8 5 4 405540 02227 5 2 0 114.0 102.0 12 140.709305 1.269E-24 7.733E-01.0643.2600 1990.85690.41-.010400 0 0 0 0 0 0 11 6 5 11 5 6 40324334222951 2 8 69.0 69.0
Pressure Broadening Pressure-broadened Widths (HWHM) are independent of vibration in some molecules. 1-0 2-0 3-0 Coefficients for these widths temperature dependence also are independent of vibration. Pressured-induced frequency shifts depend on vibration (or position): larger magnitude in Near-IR 1-0 2-0 3-0
Variation of widths by vibrational quanta Methods a. Predict from the Complex Robert-Bonamy equations. b. Estimate widths vs quanta by applying the expected theoretical vibrational dependence to empirical widths at different wavelengths. Left: The estimation method is applied to air-broadened widths of H2O. □ HITRAN 2000 widths ▲Measured widths
Self-broadened CH4 widths in near-IR bandsWidths vary as a function of quanta and band. ν1+ν4 at 4220 cm-1: Widths like those of a 3-fold degenerate (F2) fundamental. These widths are within 4% of ν3 values (at 3020 cm-1) and other bands with a 3-fold vibrational symmetry (F2). ν3+ν4 at 4310 cm-1: 9-fold degenerate band: variation of widths at each J is much greater. ν2+ν3 at 4530 cm-1: 6-fold degenerate band: some variation of widths at each J. Predoi-Cross et al.Multispectrum analysis of 12CH4 from 4100 to 4635 cm-1: 1. self-broadening coefficients (widths and shifts) – in press J. Mol. Spectrosc.
Line mixing (line coupling) in water Top: observed-calculated residuals with line mixing • Eight laboratory spectra of water at 6 μm fitted together in order to retrieve the line positions, intensities and line shape coefficients. • The maximum pressure of hydrogen is 1.3 bar at 296 K. Middle:observed-calculated residuals without line mixing Bottom:H2-Broadened H2O spectra of two pairs of P and R branch transitionsat 1539.5 and 1653 cm-1 in the ν2 band
Line shape study of pure CO (2 – band)Residuals differences between observed and synthetic spectra are offset by -0.1 and -0.2 (Brault et al. 2003).sdVoigt: speed-dependent Voigt profile with line mixing.sVoigt : speed-dependent “ “ without line mixing.
Line mixing observed in CO2 in P and R branches Top: observed-calculated differences between observed and synthetic spectra for 8 lab scans without line mixing Middle:observed-calculated residuals with line mixing between P and R branch lines Bottom:Eight lab spectra ofself-Broadened CO2 in the near –IR. Resolution: 0.011 cm-1. Signal to noise: 2000:1. Max. pressure: 1.3 bar (at 296K).
Models for Collision-Induced Continua • http://www.astro.ku.dk/~aborysow/programs/ A. Borysow, L. Frommhold calculate collision-induced spectra at different temperatures and then form model spectra of cross sections. • Very useful models and software available for generating synthetic spectra H2-H2, H2-He, H2-CH4, H2-Ar, N2-N2, CH4-CH4, N2-CH4, CH4-Ar, CO2-CO2
Low temperature spectrum of methane absorption coefficient= -ln(transmission)/(density^2 * path) Centrifugal distortion dipole lines superposed on collision-induced spectrum. First observation of R(3)-R(7) lines measurements at 0.24 and 0.06 cm-1 spectral resolution Wishnow, Leung, Gush, Rev. Sci. Inst., 70, 23 (1999) Dashed line: CH4Collision-Induced Absorption (CIA) from A. Borysow.
CONCLUSIONS • No public infrared database tailored for astronomy • Astronomers use their own private (undocumented) collections • Basicmolecular parameters (positions, intensities) available for dozens, not hundreds, of species • Near – IR: parameters missing and inaccurate • Far-IR Insufficient attention to line-by-line intensities • Pressure broadening coefficients needed (models and meas.) • CIA models need to be validated.