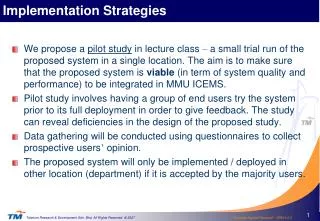
Network Implementation and Management Strategies
Network Implementation and Management Strategies. Outline. Explain why a network implementation strategy is needed Examine the principles of network design Explain why a network management strategy is needed Describe network management categories and related activities

Network Implementation and Management Strategies
E N D
Presentation Transcript
Outline • Explain why a network implementation strategy is needed • Examine the principles of network design • Explain why a network management strategy is needed • Describe network management categories and related activities • Classify current network management tools according to functionality • Examine different network management strategies • Select a management strategy for this book
Category Issues Geographical Distribution • 1.Office • ·Subnets • ·LAN • 2.Department (many offices) • ·Subnets • ·LAN • 3.Division ( many departments) • ·LAN • ·WAN • 4.Organization ( many divisions) • ·Local • qLAN • qMAN • qWAN • ·National • qWAN • ·Global • qWAN Network Implementation Design Analysis
Subnets • 1.How many • Connectivity • qBridges • qSwitches • qRouters • 2.Ethernet • Wireless • qNumber of receivers • 10BASET • qLocation of hub(s) • 10BASE2 • 10BASE5 • How many IP addresses • qStatic addresses • qAddresses supplied by DHCP Network Implementation Design Analysis (cont.)
LAN • 1.How many • 2.Domain names • 3.DNS (Domain Name Service) configuration • 4.Network address • 5.Subnets • How many • 5.Connectivity • Switched Ethernet • Router • 6.Ethernet • 7.Token Ring • 8.FDDI (Fiber Distributed Data Network) Network Implementation Design Analysis (cont.)
MAN (Metropolitan Area Network) • 1.Connectivity between LANs • qFDDI • qSONET(Synchronous Optical Network) • qLAN • qATM • qSMDS ( Switched Multi-megabit Data Service) • qDQDB (Dual Queue Dual Bus) • qEthernet WAN • 1.Connectivity between LANs or MANs • qPSTN • qX.25 • qTI-T3 • qSONET • qFrame Relay • qSMDS • qATM • qDistribution of services Network Implementation Design Analysis (cont.)
Bandwidth Requirements • 1.Video Bandwidth • Constant • Time Dependent • Bandwidth on Demand • 2.Audio Bandwidth • Constant • Time Dependent • Bandwidth on Demand • 3.Teleconferencing Bandwidth Media Requirements 1.Cable 2.Wireless 3.Microwave 4.Satellite 5.Optical Fiber Network Implementation Design Analysis (cont.)
Technology 1.What is available now 2.Minimum required for the job 3.Technology improvements during next 5 years 4.Required to support expected growth Service Level Agreements (SLA) 1.Specified bandwidth available at any time 2.Specified bandwidth available during specified time periods 3.Bandwidth on demand Security Requirements 1.Location of firewalls 2.Firewall capabilities 3.Location of proxy servers 4.Encryption and authentication needs 5.Network Intrusion Detectors (NID) Budget 1.To support resources of optimum network 2.To support resources of minimum network Network Implementation Design Analysis (cont.)
CATEGORY METRICS Reliability ·Transmission error rates ·Dropped packets ·Link failures Faults ·Proactive prevention ·Detection ·Location ·Correction time Availability ·Mean time between failures (MTBF) of network Performance • ·Time to provide a response to the user • qProcessor total use • qProcessor interrupts/sec • qProcessor queue length • qTransmit packet lengths A Network Management Categories and Associated Metrics
Throughput ·Bytes per second that a user can expect to transmit reliably. ·Guaranteed throughput based on Service Level Agreement (SLA) Data ·Packet throughput Voice ·Ordered packet throughput Video ·Link bandwidth ·Bandwidth on demand Use ·Packets/sec ·Transactions/sec Resource Use ·Application software ·Network devices ·Services ·Permanent storage ·CPU A Network Management Categories and Associated Metrics (cont.)
Policies ·Traffic ·What's Critical ·How many network control packets ·Which threshold alarms ·Alerts on what events ·What's Non-critical ·Backup-what and how often ·Application testing ·Software upgrades-how often ·Administration ·Type of service availability required ·Security level required ·Firewall protection requirements ·Network Intrusion Detection needs ·Number of Software License requirements ·User rights requirements and how distributed among which users. Redundancy ·Number of redundant systems required ·Critical alternate paths User Support ·Automatic responses to user questions about procedures ·Automatic responses to user questions about network problems ·Automatic reporting of problems and solutions to users and to a database A Network Management Categories and Associated Metrics (cont.)
A Network Management Categories and Associated Metrics (Example-Micromuse Netcool/OMNIbus)
ISO Network Management Categories (Cont.) • 效能管理 (Performance Management) • Tells you how the network is doing • 障礙管理 (Fault Management) • Tells you what your network is doing • 組態管理 (Configuration Management) • Tells you where everything is in the network • 安全管理 (Security Management) • Tells you who is using your network • 計量管理 (Accounting Management) • Tells you when your network is used
Performance Management (效能管理 ) • Performance Management • Measuring the performance of network hardware, software, and media • Measuring Metrics: • Overall throughput • Percentage utilization • Error rate • Response time
Collecting Baseline Utilization Data ·Measuring link utilization using a probe ·Counting packets received/transmitted by a specific device ·Measuring device processor usage ·Monitoring device queue lengths ·Monitoring device memory utilization ·Measuring total response times Collecting a History of Utilization Data ·Measuring utilization and response times at different times of the day ·Measuring utilization and response times on different days over an extended period Capacity Planning ·Manually graphing or using a network management tool to graph utilization as a function of time to detect trends ·Preparing trend reports to document projected need for and the cost of network expansion. Performance Management Sub-Categories and Related Activities
Setting Notification Thresholds ·Having a network management tool poll devices for values of critical parameters and graphing these values as a function of time ·Setting polling intervals ·Setting alarms/alerts on those parameters when the threshold is reached or a percentage of it is reached ·Initiating an action when the threshold is reached such a sending a message to the network manager. Building Databases ·Having the network management tool create a database of records containing device name, parameter, threshold and time for off-line analysis. ·Using the database to extract time dependence of utilization ·Using the time dependence of parameters to decide when network upgrades will be necessary to maintain performance Running Network Simulations ·Using a simulation tool to develop a model of the network ·Using the model’s parameters and utilization data to optimize network performance Latency ·Query/Response time interval Performance Management Sub-Categories and Related Activities (cont.)
Implementing Steps of Performance Management 1. 搜集目前網路設備與鏈結之使用效能相關資訊。 2. 分析所搜集之效能相關資訊。 3. 設定使用率或相關效能參數之臨界值(Threshold) 。 4. 進行網路模擬。
搜集效能相關資訊 • 網路伺服器: • processor load, disk access rate, network interface card utilization • 橋接器/路由器: • packet forwarding rate, processor load, percentage of dropped frames on each interface, number of packets being held in a queue.
Max (total bits sent , total bits received) bandwidth bandwidth total bits sent + total bits received = util% util% = 網路鏈結使用率(Link Utilization) • 一般計算方式(e.g, Ethernet, Token Ring, FDDI) • Full-Duplex Serial Link (e.g. 專線64K, ..., T1, T3)
利用SNMP讀取流量資訊 • 一般網路設備會隨時記錄其網路介面卡從開機至目前為止已流入及已流出之位元組個數,即SNMP MIB II 中之 ifInOctets 及 ifOutOctets。 • 使用SNMP,每隔一段時間週期性地讀取對應某一網路介面卡之ifInOctets及ifOutOctets值。 • 此次所讀得之值減去上次所讀得之值,即為此段時間內之流量。 • 使用率 = 一週期內之流量 / (頻寬週期)
Example • 假設某一效能管理應用程式針對此網路設備之一T1專線介面(1.544Mbps)進行流量監測, 10:00 AM: ifInOctets = 1,500,000 ifOutOctets = 1,200,000 10:05 AM: ifInOctets = 2,500,000 ifOutOctets = 7, 200,000
使用率計算 • 流量計算 • In: 2,500,000 - 1,500,000 = 1,000,000 Bytes • Out: 7,200,000 - 1,200,000 = 6,000,000 Bytes • 流量 = Max (1,000,000,6,000,000) Bytes = 6, 000,000 Bytes = 48,000,000 bits • Util% = 48,000,000/(1,544,000 60 5) 100% = 10.36%
Service Level Measurement • Total Response Time • Rejection Rate • Availability
Service Level Measurement (Cont.) • Total Response Time • the amount of time it takes a datum to enter the network and be processed and for a response to leave the network. • From the viewpoint of applications • Round Trip Time (R.T.T) is measured from the viewpoint of transport protocol.
Service Level Measurement (Cont.) • Rejection Rate • the percentage of time the network cannot transfer information because of the lack of resources and performance. • Availability • the percentage of time the network is accessible for use and operational. • Usually measured as MTBF (Mean Time Between Failure)
Analysis of Performance Information • Graphic performance informantion • Historical plots: weekly, monthly, quarterly, yearly • Real-time graphical analysis • Trend Prediction
Example of Performance Management (TANET-NCTU-2) Reference: http://mrtg.twaren.net/mrtg
What to be Analyzed/Graphed? • Device Information • memory usage, processor utilization, disk access rate, number of sessions. • Link Information • utilization, error rate, error percentage
Threshold Setup • Set thresholds on a variety of items affecting network performance • When the thresholds are crossed, events are reported. • In general, the values of thresholds are determined according to past experience.
Thresholds • Threshold Priority • In general, priority: low, medium, high • Multiple threshold values for the same item • Thresholds for multiple items • Use rearm mechanism to avoid frequent threshold events
Rearm util% Threshold Rearm 1 2 3 4 5 6 7 time
Performance Prediction • Use Regression to predict future trend. • Apply Statistics Theory • Should consider possible factors that affect the prediction. • Network Simulation
Prediction util% Threshold value . . Predicted utilization increase . . . . . . . . . . . . . . Computed actual utilization time
Fault Management (障礙管理 ) • Fault Management • Detection of a problem, fault isolation and correction to normal operation • A goal is to use trend analysis to predict faults and change network conditions so that the network is always available to users • Fault Management involves the following steps • Discover the problem • Isolate the problem • Fix the problem (if possible)
Prioritization ·Prioritize faults in the order in which they should be addressed ·Use in-band management packets to learn about important faults ·Identify which fault events should cause messages to be sent to the manager ·Identify which devices should be polled and at what intervals ·Identify which device parameter values should be collected and how often ·Prioritize which messages should be stored in the manager’s database Timeliness Required ·Management Station is passive and only receives event notifications ·Management Station is active and polls for device variable values at required intervals ·Application periodically requests a service from a service provider Physical Connectivity Testing ·Using a cable tester to check that links are not broken Fault Management Sub-Categories and Related Activities
Software Connectivity Testing • ·Using an application that makes a request of another device that requires a response. • qThe most often application for this is Ping.Exe. It calls the Internet Control Message Protocol ( ICMP) which sends periodic Echo Request messages to a selected device on a TCP/IP network • qApplication on one device makes a request of an application on another device Device Configuration ·Devices are configured conservatively to minimize chances of dropped packets. SNMP Polls ·Devices are periodically polled to collect network statistics Fault Reports Generated ·Thresholds configured and alarms generated ·Text media used for report ·Audio media used for report ·A color graphical display used to show down devices ·Human manager is notified by pager Traffic Monitored ·Remote Monitors used ·Protocol analyzers used ·Traps sent to Network Management Station ·Device statistics monitored Trends ·Graphical trends generated to identify potential faults Fault Management Sub-Categories and Related Activities (cont.)
Executing Steps for Fault Management • Discover the problem • Identifying the occurrence of a fault on the network. • Isolate the problem • Isolating the cause of the fault. • Fix the problem (if possible) • Correcting the fault.
Discover the Problem • Event report • 網路設備自行發現問題時,主動向網管系統發出事件報告(Event Report)。 • 注意:當網路設備完全故障時,無法發出任何事件報告。 • Periodic Polling • 網管系統每隔一段時間主動發出偵測訊息至被管設備,或向被管設備要求障礙相關網管資訊 。
Periodic Polling • 障礙監測之探詢週期一般設為5~15分鐘 • 探詢週期決定因素: • 及時性需求 • 被管設備之數目 • 網路頻寬 • 處理時間 • 網管通信協定之限制 例如: SNMP: Counter (32-bit) 資料歸零問題
PING • PING: Packet Internet Groper • PING為一利用ICMP ECHO / ECHO Reply所設計之TCP/IP網路探測工具。 • 功能: • 測試可否通達某一主機 • 計算封包來回時間 (Round Trip Time) • 估算封包漏失率 (Packet Loss Rate)
網管系統障礙管理功能 • 問題偵測 • 利用類似Ping方式,對每一被管設備進行偵測。 • 問題存錄(Log) • 將發生問題之設備名稱、問題發現時間、可能原因等資訊記錄於存錄(Log)檔案中。 • 狀態顏色改變 • 改變在網管系統圖形化介面中代表發生問題之設備的圖示之顏色。 • 偵測介面狀態 • 每一網路設備可能含有多個介面卡(Interface),一般網管系統會監測每一介面卡之運作狀態(Operational Status)。
網管系統障礙管理功能(續) • 事件解譯(Interpret Event) • 將探詢(Polling)結果以及收到的事件,進行解譯與進一步測試,進而找出真正障礙,通知使用者。 • 事件關聯性分析(Event Correlation) • 將探詢(Polling)結果以及收到的事件,進行關聯性分析,進而找出真正障礙,通知使用者。 • 事件/動作(Event/Action)機制 • 網管人員可以設定當某一類事件發生時,網管系統應即刻執行哪些動作(應用程式)。
Event Poll Reply Network Polling Receive Network Event Critical Network Event Generate Generate Interpret Network Event 事件解譯 No Event= Link Down ? Alert User Yes Check Carrier Signal on Source Carrier Exist ? No Alert User Link Down Yes Put Interface in Loopback Test Physical Layer Alert User Remote Device Down Test Pass ? Alert User Physical Layer Down No Yes
障礙(事件)報告方式 • 文字 (Text) • 以純文字訊息方式,顯示於螢幕上或圖形化使用者介面上之事件瀏覽器。 • 圖示 (Picture) • 改變圖示顏色,或加以閃爍方式提醒網管人員。 • 聲音 (Audio) • 以聲響方式引起網管人員注意。 • Pager • 以B.B. Call或行動電話短訊服務方式,即時告知網管人員。 • E-mail • 以E-mail方式,通知網管人員或客戶。