Download
1 / 1
10 likes | 106 Vues
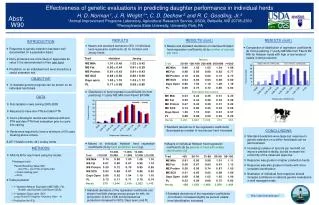
This study explores the effectiveness of genetic evaluations in predicting daughter performance in individual dairy herds. Results show how response to genetic selection can be demonstrated on a herd basis, with implications for managing and increasing productivity. The distribution of regression coefficients for various traits is analyzed, highlighting the impact of herd size and identification levels. The study concludes that while standard deviations were significant, genetic progress in well-managed herds is achievable. Methods used for evaluation and key findings are discussed.

E N D
Effectiveness of genetic evaluations in predicting daughter performance in individual herds H. D. Norman1, J. R. Wright1*, C. D. Dechow 2 and R. C. Goodling, Jr.2 1Animal Improvement Programs Laboratory, Agricultural Research Service, USDA, Beltsville, MD 20705-2350 2Pennsylvania State University, University Park, PA Abstr. W90 2010 INTRODUCTION • Response to genetic selection has been well documented on a population basis • Dairy producers are more likely to appreciate its value if it is demonstrated in their own herd • Prediction on an individual herd level should be a useful extension tool RESULTS • Means and standard deviations (SD) of individual herd regression coefficients (b) for Holstein and Jersey herds RESULTS (cont.) RESULTS (cont.) • Means and standard deviations of individual Holstein herd regression coefficients (b) by number of records per herd • Comparison of distribution of regression coefficients (b) from predicting 1st parity ME Milk from Parent BV Milk for Holstein herds with high or low levels of usable id and production Trait Holstein Jersey • ME Milk 1.01 ± 0.45 1.02 ± 0.42 • ME Fat 0.90 ± 0.44 0.91 ± 0.39 • ME Protein 0.81 ± 0.43 0.91 ± 0.43 • ME SCS 0.88 ± 0.60 0.86 ± 0.69 • Days open 1.03 ± 1.10 1.03 ± 1.12 • PL 0.71 ± 0.69 0.69 ± 0.80 Means Trait 50-99 100-199 200-499 500-999 >1000 ME Milk 0.96 1.02 1.05 1.04 1.06 ME Fat 0.88 0.95 0.90 0.82 0.77 ME Protein 0.78 0.84 0.82 0.73 0.73 ME SCS 0.94 0.94 0.84 0.68 0.60 Days Open 0.80 1.02 1.18 1.28 1.19 PL 0.69 0.75 0.72 0.66 0.64 Standard Deviations ME Milk 0.53 0.43 0.38 0.31 0.25 ME Fat 0.50 0.44 0.39 0.32 0.28 ME Protein 0.47 0.43 0.39 0.31 0.29 ME SCS 0.74 0.60 0.45 0.32 0.26 Days Open 1.30 1.15 0.91 0.67 0.57 PL 0.88 0.69 0.50 0.35 0.26 Herds 2,251 2,867 1,533 473 355 Percent of herds OBJECTIVE • To illustrate genetic progress can be shown on an individual herd basis. • Distribution of herd regression coefficients (b) from predicting 1st parity ME Milk from Parent BV Milk DATA • First lactation cows calving 2005-2008 • Required to have sire PTA and dam PTA • Cow’s phenotypic record was matched with sire PTA and dam PTA from evaluation prior to cow’s first calving • Herds were required to have a minimum of 50 cows meeting above criteria • 8,257 Holstein herds; 441 Jersey herds Regression Coefficient (b) Percent of herds • Standard deviations of the regression coefficients decreased as number of records per herd increased CONCLUSIONS • Standard deviations were large but response to genetic selection on a within-herd basis can be demonstrated • Increasing number of records per herd did not improve predictive ability, but did increase the uniformity of the observed response • Response was greater in higher production herds • Response was also greater in herds with more complete identification • Illustration of individual herd response should increase confidence in national genetic evaluations in well managed herds Regression Coefficient (b) • Means of individual Holstein herd regression coefficients (b) by herd production level (kg) • Means of individual Holstein herd regression coefficients (b) by percent of herd with usable identification (id) • METHODS • SAS GLM for each herd using the model: Phenotypic trait= Parent Breeding Value (BV) (Sire PTA + Dam PTA)of same trait + Cow’s calving year + Error • Traits predicted: • 1st lactation Mature Equivalent (ME) Milk, Fat, Protein, and Somatic Cell Score (SCS) • 1st lactation Days open (DO) (using Parent BV Daughter Pregnancy Rate * -4) • Productive life (PL) 10,000- 11,000- 12,000- Trait <10,000 10,999 11,999 12,999 ≥13,000 ME Milk 0.74 0.90 1.00 1.08 1.16 ME Fat 0.67 0.80 0.87 0.95 1.10 ME Protein 0.59 0.72 0.79 0.85 0.95 ME SCS 0.93 0.89 0.87 0.86 0.92 Days Open 0.86 0.92 1.04 1.10 1.10 PL 0.72 0.71 0.71 0.70 0.74 Herds: 579 1,244 2,184 2,052 1,143 Trait <50 50-74 75-89 90-98 99-100 ME Milk 0.91 0.95 0.98 1.01 1.11 ME Fat 0.56 0.67 0.83 0.97 1.12 ME Protein 0.50 0.59 0.74 0.87 1.00 ME SCS 0.51 0.65 0.82 0.98 1.06 Days Open 0.90 0.98 1.02 1.05 1.09 PL 0.53 0.59 0.68 0.75 0.82 Herds489 1,063 1,468 3,000 1,489 • Standard deviations of the regression coefficients (not shown) had little change across groups for milk, fat and protein (0.42 to 0.48) but decreased as production increased for SCS, Days open, and PL • Standard deviations of the regression coefficients (not shown) increased slightly as percent usable herd identification increased http://aipl.arsusda.gov/