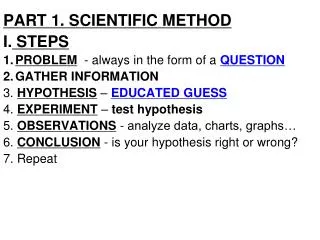
Scientific Method & Experimental Design
This guide explores the Scientific Method and Experimental Design using paper airplanes as a case study. It provides a structured approach to making observations, establishing a problem, forming a hypothesis, designing an experiment, and analyzing results. By investigating how wing shape affects flight distance, students will gain hands-on experience in scientific inquiry. The process includes stating a clear problem, predicting outcomes, and thoroughly documenting experimentation to collect both qualitative and quantitative data, culminating in a well-supported conclusion and recommendations for future research.
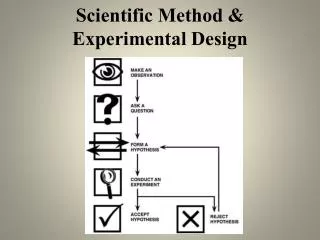

Scientific Method & Experimental Design
E N D
Presentation Transcript
1. Make broad observations about your topic (Introduction) Begin by asking questions about your topic: • Why? • How come? • Does it always happen? • Are there problems you want to resolve? • Ex. The wing shape of a paper airplane appears to affect the distance the airplane travels.
Powers of Observation USE YOUR SENSES Sight Sound Touch Taste Smell
2. Establish a problem (Problem) • State the problem in the form of a question. • Ex. Will a paper airplane with an “improved” wing shape fly farther than an airplane with a “normal” wing shape?
3. Form a hypothesis (Hypothesis – part of the Introduction) • A hypothesis is… …a testable statement. • Ex. If airplane wing shape is related to distance traveled, then the airplane with the improved (longer, wider, narrower, etc.) wing shape will travel a longer distance.
4. Design an experiment to test your hypothesis (Materials and Methods) • Must design an experiment that will test your hypothesis. • This experiment will allow you to change some conditions or variables to test your hypothesis.
Variables Independent Variable Dependent Variable Changes in response to the independent variable. It is the responding variable. • The variable that is purposely changed. • It is the manipulated variable. • For example: • Students change the wing shape of a paper airplane and measure the distance the plane travels. • The dependent variable would be the ___________________ • The independent variable would be the ___________________
Constant or Controlled Variables • These are variables that could be changed but they are deliberately held constant. • SO WHAT DOES THAT ALL MEAN? • A simple experiment has one independent variable. • All other variables are held constant. • Result: Any effect on the outcome must be from that single independent variable
Control Group A control group should be used when conducting an experiment. • WHY? • This group receives the same attention as the test groups • not be influenced by the independent variable Group #1 contains airplanes with normal (typical) wing shape. Group #2 contains airplanes with an altered wing shape. Control group ____________________________ Experimental (test) group ____________________________
Materials and Methods • List lab materials. • Write out a step-by-step procedure (paragraph form or numbered steps).
5. Collect and organize data (Results/Data) QUALitative Observations QUANTitative Observations Deals with numbers Data is measured Length, height, area, volume, weight, speed, time, temperature, humidity, sound levels, cost, members, ages Quantitative → Quantity • Deals with descriptions • Data is observed but not measured • Colors, textures, smells, tastes, appearance, beauty Qualitative → Quality
EXAMPLE - latte QUALitative data QUANTitative data 354 ml of latte serving temperature 65º C Cup is 24 cm in height cost $4.95 • robust aroma • frothy appearance • strong taste • burgundy cup
Graphing DATA The effect of the independent variable on the dependent variable Independent Variable – units, appropriate scale
6. Analyze data (Analysis) • Centerpiece of your lab report • 2 – 3 paragraphs of text • What were the major findings of your study? • Avoid interpreting your results…just present your findings
7. State a conclusion (Conclusion) • Hypotheses are never “wrong”. They are either supported or not supported by the data. • Do your results support your hypothesis? • WHY/WHY NOT? Give reasons why you hypothesis is supported or not. • Experimental error? • What factors in your materials or method might have had an impact on your results? • Recommendations for further experimentation? • Did other questions come up while performing the experiment? • Could you adapt and improve the current experiment?
COMMUNICATE • Publish your results • Peer review